

Customer loyalty, retention, and revenue growth all trace back to one critical foundation: measurable, high-impact customer experience metrics. In 2025, brands that track the right CX KPIs and accumulate the correct data are building competitive advantages. Global leaders in retail know that exceeding customer expectations directly translates into higher conversion rates, stronger lifetime value, and long-term profitability. Tools like ContactPigeon’s CDP make this possible by personalizing retail experiences at scale, helping retailers surpass global CX benchmarks and transform every touchpoint into meaningful business outcomes.
✔️ Short on time? Catch the key insights on the go.
What are customer experience metrics & why they matter

Customer Experience Metrics are measurable indicators that track how effectively a brand meets or exceeds customer expectations at every stage of the journey — from awareness to long-term loyalty. These KPIs capture how customers perceive, engage with, and react to brand interactions, whether through digital channels, in-store experiences, or post-purchase support.
In today’s hypercompetitive environment, CX metrics matter because they reveal the direct connection between experience quality and business outcomes. Monitoring key indicators like Net Promoter Score (NPS), Customer Satisfaction (CSAT), and retention rates allows retailers to identify friction points, optimize engagement, and drive sustainable growth. Brands that align their CX KPIs with every phase of the funnel — attracting new customers, converting them efficiently, and cultivating loyalty — achieve stronger revenue performance, higher retention, and a clear competitive edge.
6 core customer experience KPIs in 2025
In 2025, leading retailers are laser-focused on six essential Customer Experience (CX) KPIs that directly impact loyalty, retention, and long-term growth. These metrics provide visibility across the customer journey and help brands align their strategies with evolving expectations.
1. Net Promoter Score (NPS)
What it measures: NPS tracks customer loyalty by asking a simple, yet powerful question: How likely are you to recommend our brand to others? This score reflects not just satisfaction but genuine advocacy — the willingness of customers to become brand ambassadors, often strengthened by AI agents in fashion retail that personalize engagement
2025 Retail Benchmark: The average NPS across retail sits at 41. High-performing brands consistently achieve scores above 50, signaling exceptional customer relationships and advocacy.
Tip: Regularly segment your NPS data to identify promoters, passives, and detractors. Use this insight to strengthen retention programs and convert passive customers into loyal advocates.
2. Customer Satisfaction Score (CSAT)

What it measures: CSAT captures immediate customer satisfaction, typically after a specific interaction like a purchase, service inquiry, or support call. It reflects how well your brand delivers on expectations in critical moments.
Global Benchmark: Retail and eCommerce sectors report average CSAT scores between 76–78%, indicating generally high satisfaction levels — but also highlighting room for differentiation.
Tip: Deploy CSAT surveys after key touchpoints, including online purchases and customer service interactions, to gather actionable feedback and refine CX strategies.
3. Customer Effort Score (CES)
What it measures: CES evaluates how easy it is for customers to interact with your brand, resolve issues, or complete transactions. Lower effort directly correlates with higher loyalty and repeat business.
Best-in-Class Benchmark: Top companies aim for CES scores below 2.0 on a 1–5 scale, with leaders maintaining averages around 1.5, indicating effortless customer experiences.
Tip: Streamline processes across channels — from checkout flows to post-purchase support — to reduce friction, particularly in high-consideration categories where AI agents for electronics guide complex purchase decisions.
4. First Response Time (FRT)
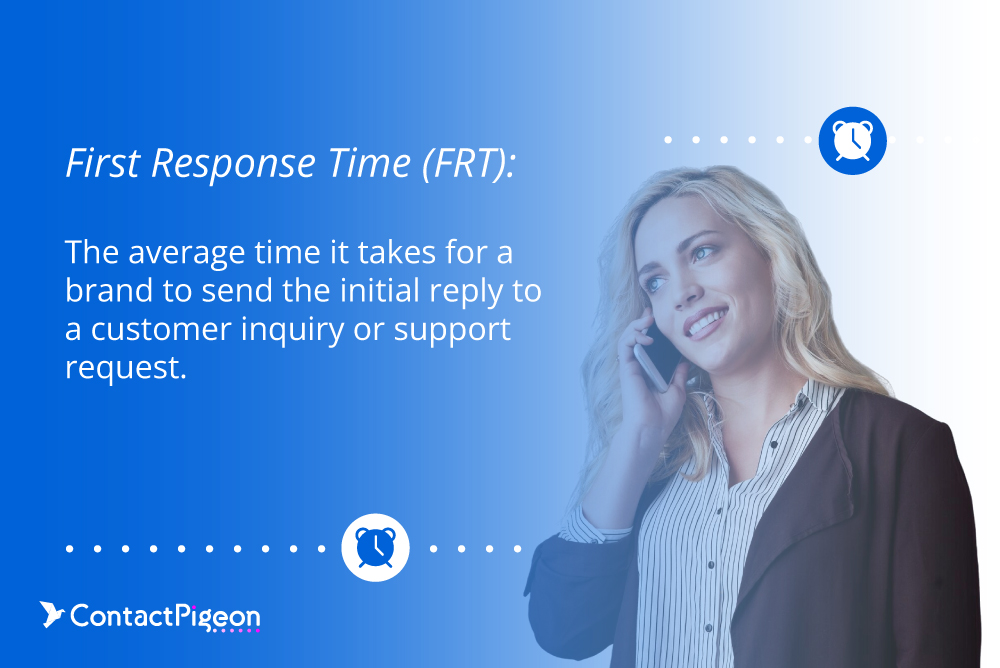
What it measures: FRT tracks how quickly your team responds to customer inquiries, especially via live chat, email, or messaging platforms. Fast responses are crucial for satisfaction and trust.
Live Chat Benchmark: The average first response time in 2025 is 50–60 seconds, with AI chatbots in retail handling nearly 74% of initial chats, reinforcing the need for responsive, tech-enabled support.
Tip: Combine AI automation with human expertise to deliver prompt, personalized support across channels.
5. Churn Rate / Retention Rate
What it measures: Churn rate reflects the percentage of customers lost over a given period, while retention measures how many stay. Together, they indicate the health of your customer base.
Global eCommerce Churn: Retailers face an average churn rate of 25.4%, underscoring the importance of CX-driven retention programs.
CX Tip: Leverage reactivation campaigns with personalized messaging to reduce churn and maximize customer lifetime value (CLV).
6. First Contact Resolution (FCR)
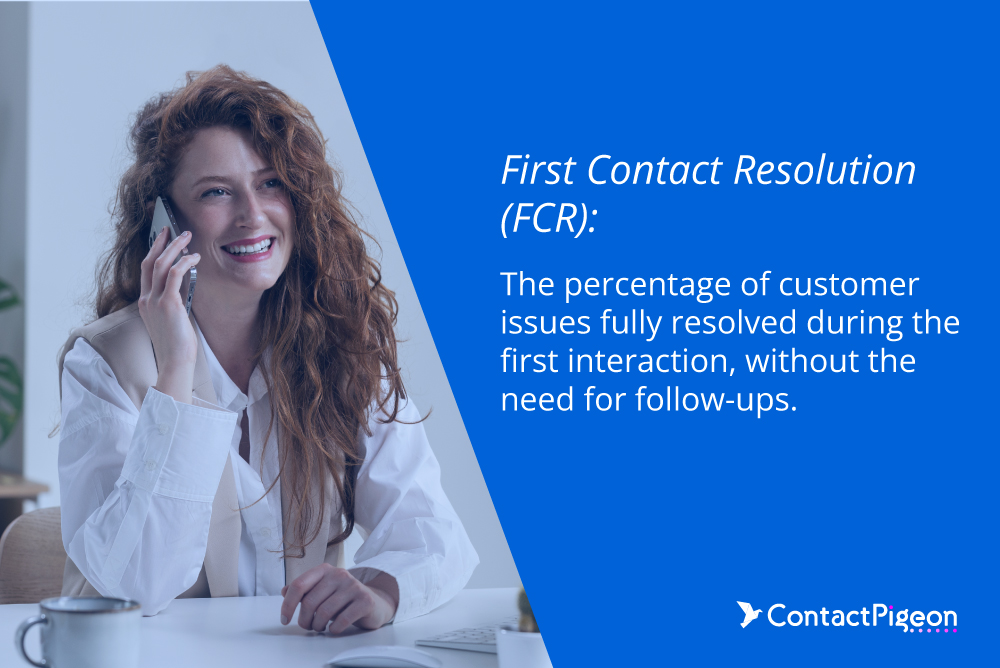
What it measures: FCR assesses the percentage of customer issues resolved during the first interaction, directly influencing satisfaction and operational efficiency.
Strategic Benchmark: The average FCR rate in eCommerce is around 70%, with top-performing brands reaching up to 80%.
Tip: Equip support teams with the tools and knowledge to resolve issues swiftly, fostering trust and reducing repeat contacts.
CX performance benchmarks by industry
To stay competitive, brands must not only track internal CX metrics but also benchmark against industry leaders. This table provides a snapshot of 2025 CX performance benchmarks across key sectors, helping you understand how your brand compares.
| Industry | NPS Avg | CSAT Avg | CES Avg | Notes |
|---|---|---|---|---|
| Retail (eCommerce) | 40 to 62 (Good ≥ 45) | 70%-85% | Above 4.3 | AI personalization and omnichannel CX are key retail strengths. |
| SaaS (Software as a Service) | 36 | 75%-85% | 4 or higher | CX focuses on user-friendly design and proactive support. |
| Hospitality | 44 | 80%-85% | Typically below 3 | AI concierge services and personalization drive loyalty. |
| Healthcare | +38 to +58 | 76%-80% | 5.6 (7-point scale) or 4.2 (out of 5) | Digital solutions reduce patient effort and improve CX. |
| Financial Services | 44 | 75%-85% | 4.4 | Digital banking and personalization drive CX improvements. |
| Telecom | ~31 | Around 65% | ~3.6 | Focus on service delivery and support to improve CX. |
Advanced predictive & behavioral customer experience metrics
The most successful brands in 2025 go beyond basic satisfaction surveys. The table below highlights advanced CX metrics that leverage predictive data and real-time behavior to drive loyalty, retention, and revenue.
| Metric Name | What It Measures | Why It Matters | How to Use It |
|---|---|---|---|
| Repeat Purchase Rate | Percentage of customers making more than one purchase within a defined period. | Indicates retention success, loyalty development, and CLV potential. | Segment high-value customers, optimize loyalty programs, and forecast lifetime value trends. |
| Personalization Success Rate | Ratio of personalized interactions that drive engagement or conversions. | Measures effectiveness of AI-driven, individualized experiences at scale. | Optimize dynamic content, refine segmentation, and test AI models for higher conversion. |
| Browse Abandonment Rate | Percentage of sessions where users browse but exit without meaningful action. | Identifies friction points and lost opportunities in the discovery phase. | Trigger retargeting, deploy exit-intent offers, and enhance product recommendation UX. |
| Customer Recovery Velocity (CRV) | Average time to resolve and re-engage after a negative CX incident. | Fast recovery reduces churn risk and protects brand reputation. | Automate recovery journeys with tailored follow-ups and incentives based on CRV trends. |
| CX Journey Drop-Off Heatmaps | Visual mapping of where customers exit the journey across channels. | Reveals hidden friction and underperforming stages in the experience. | Prioritize UX fixes, remove bottlenecks, and refine multi-step journeys to reduce drop-offs. |
| Emotion Sentiment Score (AI/NLP) | AI-driven analysis of customer sentiment across reviews, chats, and interactions. | Uncovers emotional drivers behind loyalty, churn, or dissatisfaction. | Feed sentiment insights into CX, support, and content strategies to strengthen connections. |
The 2025 CX maturity model: From reactive to predictive
Delivering exceptional CX requires progression through clear stages of maturity. This model outlines how organizations evolve from reactive efforts to predictive, AI-driven experiences that fuel growth and customer lifetime value.
| Stage | Characteristics | KPIs Tracked | Tools Used |
|---|---|---|---|
| Reactive | CX efforts are unstructured, mainly responding to complaints. | Complaint Volume, First Response Time (FRT) | Basic support channels, email, manual processes |
| Basic | CX is monitored through simple surveys and feedback collection. | CSAT, NPS, Response Time | Survey tools (e.g., SurveyMonkey), basic CRM |
| Integrated | CX data is centralized across teams to enable consistent, multichannel experiences. | NPS, Retention Rate, First Contact Resolution (FCR) | ContactPigeon CDP, omnichannel automation, CRM |
| Predictive | CX is driven by data, AI, and proactive personalization across the lifecycle. | Personalization Success Rate, Churn Rate, Repeat Purchase Rate | ContactPigeon CDP, AI personalization, analytics platforms |
What’s next in customer experience metrics: KPIs to watch beyond
As customer expectations continue to evolve, traditional CX metrics alone won’t be enough to stay competitive. The next generation of Customer Experience KPIs focuses on predictive insights, emotional engagement, and sustainability, aligning CX measurement with broader business goals like loyalty, differentiation, and environmental impact. Here are five advanced metrics senior CX leaders should integrate into their dashboards beyond 2025:
Emotional sentiment scoring (AI-Powered)
AI-driven analysis of customer language, tone, and behavioral cues to quantify emotional response across digital and human touchpoints. Moving beyond binary satisfaction scores, this metric reveals how customers feel, identifying hidden loyalty risks or brand advocates. Top brands use emotional sentiment scoring to adapt content, support, and UX in real time, strengthening emotional connections that drive retention.
Channel stickiness score
Measures how consistently customers return to or rely on a specific channel (e.g., mobile app, live chat, SMS) for interactions. High channel stickiness indicates channel preference and CX efficiency, while low scores flag friction or unmet expectations. CMOs can leverage this insight to optimize high-performing channels and streamline the customer journey across touchpoints.
Personalization Success Index (PSI)
Tracks the effectiveness of AI-driven personalization by analyzing conversion rates, engagement, and customer satisfaction across personalized experiences. A high PSI signals that hyper-personalized content, product recommendations, and messaging are resonating. Brands use PSI to refine segmentation models, A/B test personalization tactics, and maximize ROI from their CDP and automation investments.
Voice Experience Feedback (VOX)
Captures satisfaction and usability insights from voice-based interactions, including voice assistants, IVR systems, and AI-powered conversational tools. As voice becomes more prevalent in CX, VOX metrics help brands assess clarity, accuracy, and ease of use. High VOX scores reflect seamless, intuitive voice experiences that reduce effort and build trust.
Customer experience carbon score (Sustainability impact)
Evaluates the environmental footprint of customer journeys, factoring in packaging, delivery options, returns, and operational emissions tied to CX. With sustainability influencing brand preference, the CX Carbon Score helps align experience strategies with ESG (Environmental, Social, Governance) commitments. Retailers are increasingly using this metric to design eco-conscious experiences without sacrificing convenience.
Why customer experience metrics are the new ROI
In 2025, tracking and optimizing the right customer experience metrics is a strategic imperative for market leadership. Brands that consistently align their CX performance with global benchmarks see measurable gains in revenue, loyalty, and long-term growth. The most successful retailers go beyond basic metrics, leveraging advanced insights to personalize at scale, reduce friction, and foster emotional connections that drive retention.
With ContactPigeon’s CDP and automation suite, brands unlock the power to monitor performance in real time, exceed industry benchmarks, and deliver hyper-personalized experiences across every channel. From behavioral segmentation to AI-driven journey optimization, ContactPigeon empowers you to translate CX data into business impact.