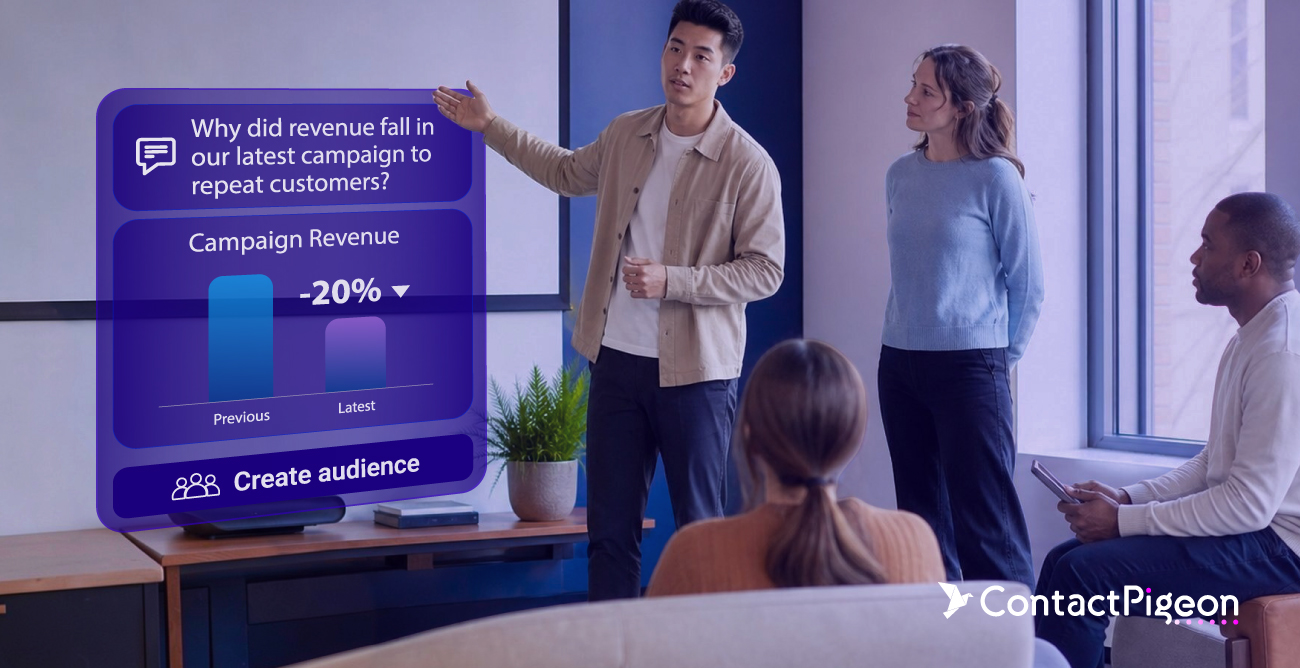
Campaign reports give marketing leaders plenty to discuss: revenue, purchase rates, average order value. The harder questions often come afterward. Why did an audience respond differently, and should that change the next campaign? Conversational analytics lets retail teams pursue those questions through natural-language queries and follow-ups, with evidence they can examine as the discussion develops.
For a CMO or CRM Director, the value lies in how that changes campaign planning. If fewer recipients bought, increasing the discount may be the wrong response. The audience may include more recent purchasers, or the promoted products may suit a different group. Each possibility has implications for budget, relevance, and customer contact.
This guide explains where conversational analytics helps retail marketers, what makes its answers useful, and how to carry a finding into campaign planning. A short illustrative comparison shows how a follow-up question can change the decision a team considers.
What is conversational analytics in retail marketing?
The practical value becomes clear during a campaign review. A dashboard may show that revenue fell, while the team needs to decide whether to change the audience, offer, or message. Answering that question can require another breakdown, a spreadsheet export, or an analyst request. Where the relevant data and capabilities are available, conversational analytics gives marketers a more direct way to explore those follow-ups while the decision is still being discussed.
Several marketing questions fit this approach. A CRM Director might compare responses across customer groups before revising targeting. A campaign owner might explore which products contributed to a revenue change before asking merchandising to review the selection. A CMO might examine whether stronger sales also came with heavier discounting before committing more budget. Each question connects analysis to a choice with a commercial consequence.
The interface still needs a consistent understanding of the business. For example, “repeat customer” could mean anyone who has bought before or someone with at least two completed orders. Google’s documentation describes how conversational analytics in Looker uses a semantic model—a shared set of business definitions—to interpret metrics and construct queries. The implementation varies by platform, but the underlying requirement is relevant across tools: the team needs to know what an answer measures.
Here, conversational analytics means querying business data. Conversational analytics commonly refers to analysing customer calls, chats or other interactions for topics, sentiment and service issues. For the campaign questions in this article, the relevant foundation is customer, campaign and transaction data.
What data do you need for conversational campaign analytics?
A conversational answer needs to make its basis clear: which customers it includes, which period it covers and how the metric is defined. Those details let a marketing team judge whether the answer supports the decision in front of them.
CEO and co-founder, ContactPigeon
Campaign analysis starts with a reliable connection between campaign records, customers and purchases. By linking delivery records with customer histories and orders, teams can see who received a message, what their relationship with the retailer looked like at that point, and what they bought during the period being assessed. Those connections give the answer its context; gaps between the records can leave the team with an incomplete view of performance.
The information needed becomes more specific as the investigation develops. Understanding which categories contributed to sales requires product and order-line data, while assessing profitability also depends on discounts and costs. If the team suspects that availability affected results, it needs inventory records from the campaign period. Transaction data alone cannot reveal whether shoppers encountered out-of-stock products or how much margin their purchases generated.
Consistent definitions and measurement periods help the team interpret these findings. Revenue figures can differ depending on whether they include refunds, tax, and shipping, just as a purchase rate depends on which customers are counted. Even correctly calculated results can be misleading when one campaign has had seven days to generate orders, and another has had a month. Making those definitions and timeframes visible alongside the answer helps marketers assess whether they have a fair basis for comparison.
The team also needs to understand where the data is incomplete. Missing store purchases could make an active omnichannel customer appear inactive, while duplicate profiles could spread one person’s purchase history across several records. When these gaps could affect a recommendation, identifying the missing evidence gives the team a useful next step before it changes targeting or commits more budget.
How to analyze retail campaign performance with conversational analytics
A productive starting point is a question connected to a decision: “What changed in the latest campaign, and which part deserves our attention?” Revenue, purchasers and average order value provide different clues. From there, follow-up questions can explore audience composition, product selection or purchasing patterns, depending on what the first answer shows.
Consider a retailer reviewing two promotions with the same offer mechanics. Campaign A recorded €50,000 in net merchandise revenue among recipients; Campaign B recorded €40,000. Both reached 10,000 repeat customers and use the same seven-day purchase window. These figures are synthetic and illustrative, not a ContactPigeon customer result or a product demonstration.
The first question is: “Did fewer customers buy, or did buyers spend less?” Campaign A had 500 purchasers and Campaign B had 400. Average order value stayed at €80, and orders per purchaser stayed at 1.25. This locates the revenue change in the number of buyers and gives the team a reason to examine the audience before increasing the discount.
A useful follow-up is: “How do purchase rates compare by the time since each customer’s previous order?” The groups below use purchase history at send time. Fourteen days is an illustrative boundary; a meaningful interval would depend on the retailer’s products and buying cycle.
| Group at send time | Campaign A: recipients / purchasers |
Campaign B: recipients / purchasers |
Purchase rate: A / B |
|---|---|---|---|
| Last purchase ≤14 days | 2,000 / 20 | 4,000 / 40 | 1% / 1% |
| Last purchase >14 days | 8,000 / 480 | 6,000 / 360 | 6% / 6% |
| Total | 10,000 / 500 | 10,000 / 400 | 5% / 4% |
Recent purchasers made up 20% of Campaign A’s audience and 40% of Campaign B’s. Their purchase rate was 1% in both campaigns; the other group purchased at 6% in both. The overall rate fell from 5% to 4% because Campaign B contained a larger share of the group with the lower purchase rate.
That finding changes the planning discussion. The team now has a specific reason to investigate how it engages customers who have just bought. A larger discount, a different product selection and a later message would each address a different possible explanation. The breakdown does not tell the team which will work, or prove that purchase recency caused an individual customer’s response.
This is the contribution of the conversation: the broad revenue question leads to a more focused audience question, with figures the team can inspect. A different result could lead elsewhere. Falling order values might prompt a review of product mix or discounts; a decline concentrated in one category might warrant a check of historical availability. The follow-up should reflect what the evidence shows.
How to turn conversational analytics insights into marketing decisions
An insight becomes useful when it helps the team make a more informed campaign decision. In the example, the audience breakdown gives marketers a reason to reconsider how they engage recent purchasers, taking into account the buying cycle, the relevance of the next offer and the messages those customers already receive. Together, these factors can help the team decide whether to test a different message or allow more time between a purchase and the next promotion.
Other findings can lead to different conversations across the business. A decline in category revenue might prompt marketing and merchandising to review product availability and selection, while a customer group that buys mainly under deeper discounts may warrant a closer look at margin before receiving more promotional budget. Conversational analytics helps focus these discussions by showing where performance changed, giving the people involved a clearer starting point for evaluating possible responses.
For a recommendation to carry through into planning, colleagues need to understand the evidence behind it. Keeping the customer group, measurement period, metric definitions and supporting figures alongside the finding makes it easier to review the reasoning and identify any unanswered questions. Analysts can help resolve conflicting definitions or discrepancies between records, particularly when those issues could change the recommendation.
The proposed response then needs a fair way to assess its impact. For recent purchasers, the team could test a different message or timing against its current approach using comparable groups. Simply excluding less responsive customers might raise the reported purchase rate while reducing total sales, so the comparison needs to account for outcomes across everyone assigned to each approach, along with the relevant costs.
This gives the campaign brief a clear purpose: to connect what the team observed with a proposed change and explain how it will judge the result. By recording the reasoning, remaining uncertainties and measures of success, marketing leaders can make the finding useful beyond the review meeting and support more consistent data-driven decision-making in retail.
Investigate campaign results with Menura AI Data Canvas
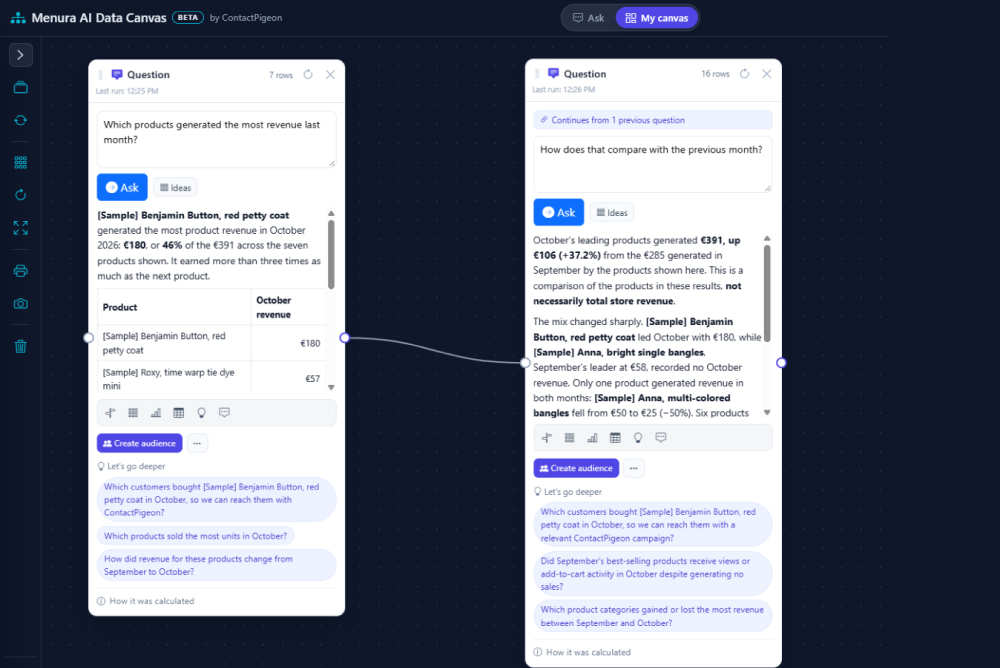
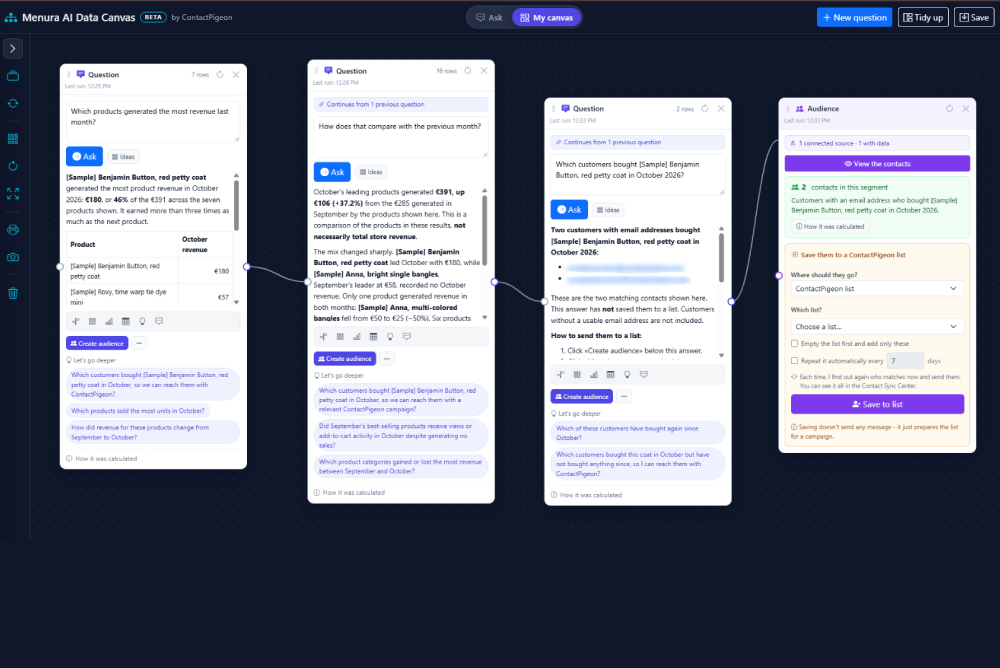
Menura AI Data Canvas helps marketing teams bring what they learn from their data into campaign planning. As they explore customer groups through follow-up questions, they can review the supporting figures and save useful findings to My Canvas with Keep it. Using the data available in their account, teams can then create audiences for activation in ContactPigeon, Google Audiences or Meta Audiences, keeping the audience choice connected to the evidence that informed it.
A clearer basis for your next campaign decision
Conversational analytics can help retail marketing teams explore the questions that arise between reviewing a report and choosing the next campaign approach. Its value depends on relevant data, understandable answers, and a clear connection to the decision at hand. For a CMO or CRM Director evaluating it, a useful starting point is a recurring campaign question: can the team investigate it, examine the evidence, and use what it learns to make a more informed choice?
To explore how this could work with your retail data, book a demo with ContactPigeon. You can also explore Menura AI Data Canvas for a closer look at its analytics and audience capabilities.
Frequently asked questions about conversational analytics for retail marketing
What is the difference between conversational analytics and conversation analytics?
Terminology can overlap. This guide uses conversational analytics to mean asking questions of business data in natural language. Conversation analytics commonly refers to examining interactions such as customer calls, chats or messages for topics, sentiment or service issues. Check the actual use case when comparing tools.
Do retail marketers still need an analyst?
Yes. Analysts help establish trusted definitions, reconcile discrepancies and design meaningful tests. A conversational interface can make follow-up exploration more accessible to marketers, while the level of analyst involvement depends on the complexity of the question and the reliability of the underlying data.
What happens if relevant data is missing?
The answer is limited by the records available. Purchase data can show which categories sold, for example, while historical inventory is needed to assess whether stock shortages affected sales. Identifying that gap gives the team a specific piece of evidence to pursue before changing the campaign.
Can conversational analytics explain why campaign performance changed?
It can help locate differences and investigate possible explanations. Establishing that a campaign or audience rule caused an outcome requires an appropriate research design. A before-and-after comparison may reflect seasonality, audience composition or other activity. Use the investigation to decide which explanation deserves testing.