


While many retailers focus on cart abandonment, understanding checkout abandonment is just as critical for maximizing conversions. Checkout abandonment refers to customers who leave during the final step of the purchasing process, and the impact is substantial. Remember that 22% of shoppers abandon their purchase due to a long or complicated checkout process. The key purpose of this guide is to serve as a comprehensive resource, compiling all relevant checkout abandonment stats for 2024. Whether you’re building a strategy to reduce friction or improve the checkout experience, this article will be your guiding light whenever you need actionable insights and benchmarks. Optimizing your checkout abandonment rate with data-driven insights is key to turning more visitors into paying customers.
What is the “checkout abandonment rate”?
The checkout abandonment rate is the percentage of customers who begin the checkout process but do not complete their purchase. Because checkout abandonment happens in the final stages of the funnel, a retail customer journey builder can help retailers identify and optimize the touchpoints where purchase intent is highest.
How ContactPigeon’s CDP can aid with checkout abandonment optimization

- Unified Customer Data: ContactPigeon’s CDP consolidates data across channels, allowing you to create a detailed profile of each shopper. This enables hyper-personalized interventions, such as real-time abandoned checkout reminders via email, SMS, or push notifications.
- Behavioral Insights & Predictive Analytics: Leverage predictive analytics to understand and anticipate when a customer is likely to abandon their checkout. ContactPigeon’s CDP uses past behaviors to trigger timely offers, such as discount pop-ups or limited-time offers, that can reduce abandonment rates. Combined with Menura AI, these behavioral insights can become guided checkout assistance, helping shoppers resolve doubts, understand offers, and complete their purchase with confidence.
- Multi-Channel Retargeting: This supports a stronger omnichannel personalization strategy, bringing customers back to checkout through the channel they are most likely to engage with.
- Advanced A/B Testing for Checkout Pages: Optimize every element of your checkout flow using ContactPigeon’s robust A/B testing capabilities. Test everything from button placements to payment options and identify the best-performing configurations that minimize friction.
- Dynamic Pop-Ups & Smart Logic Automation: ContactPigeon’s CDP can trigger dynamic pop-ups or exit-intent messages based on the customer’s journey, reminding them of their incomplete purchase or offering additional support to remove any purchasing barriers.
Tired of losing customers at checkout? Book a demo with ContactPigeon to see how our CDP can help you reduce checkout abandonment and increase conversions.

Checkout vs. cart abandonment rate
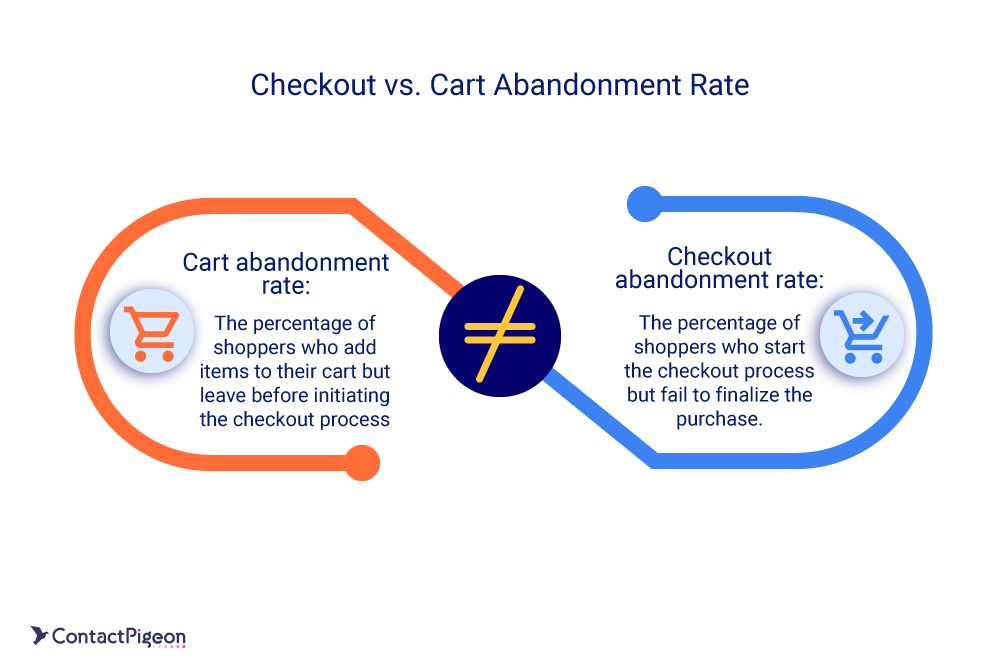
While the cart abandonment rate tracks the percentage of shoppers who add items to their cart but leave before initiating the checkout process, the checkout abandonment rate zeroes in on those who start the checkout process but fail to finalize the purchase. Checkout abandonment is often more critical since it occurs at the point where the purchase intent is highest, meaning its reduction can have a greater impact on revenue. On average, checkout abandonment rates tend to be lower than cart abandonment, but they result in higher losses per transaction due to the advanced stage of the buying journey.
The 8 checkout abandonment metrics every retailer needs to track
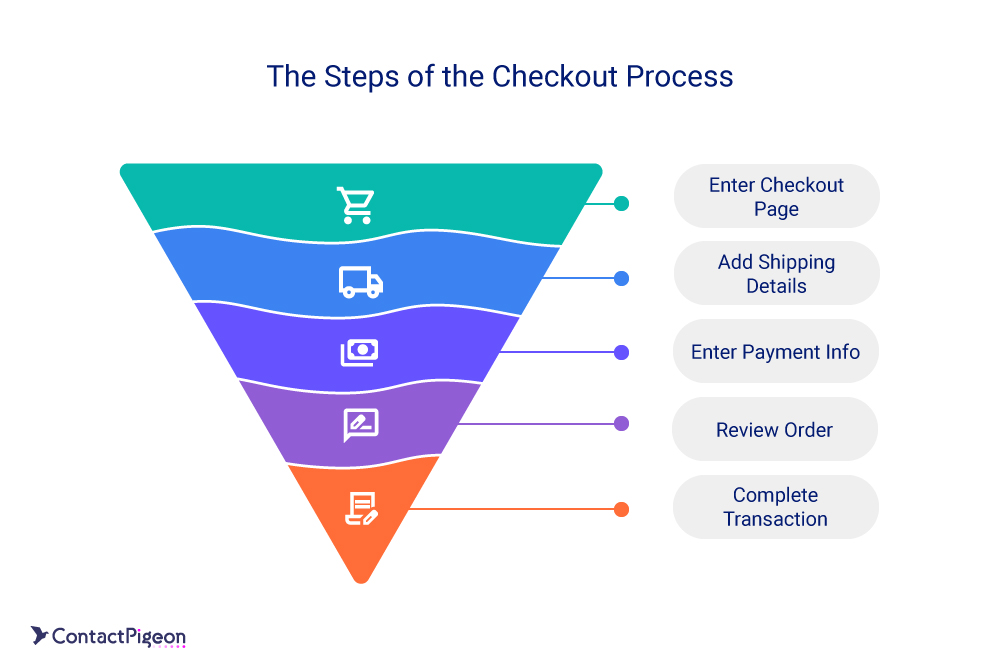
To effectively reduce checkout abandonment, retailers must understand the specific points where potential customers drop off during the purchase process. The following key metrics provide insights that can help optimize every stage of the customer journey, from cart to payment.
Checkout metric #1: Cart-to-checkout conversion rate
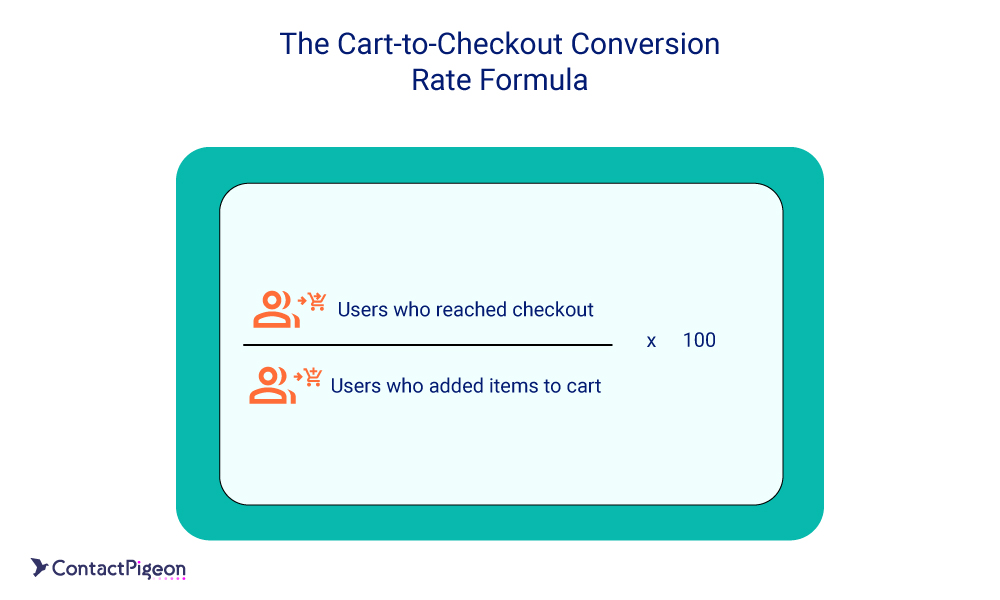
What it measures: The percentage of users who add items to their cart and proceed to the checkout page.
Why it’s important: This metric indicates how effectively your site motivates users to initiate the checkout process. A low rate may highlight issues in cart or checkout page design, user experience, or unclear shipping costs.
Benchmark: 6.99% (Dynamic Yield)
How to optimize:
- Simplify the cart design and highlight the “Proceed to Checkout” button clearly.
- Offer instant discounts or promotions when customers proceed to checkout.
- Provide transparent shipping costs and taxes upfront.
Useful tools:
- Web analytics platforms to track user behavior
- Heatmapping tools to identify friction points
- eCommerce analytics software to monitor cart-to-checkout conversion rates
Checkout metric #2: Checkout abandonment rate
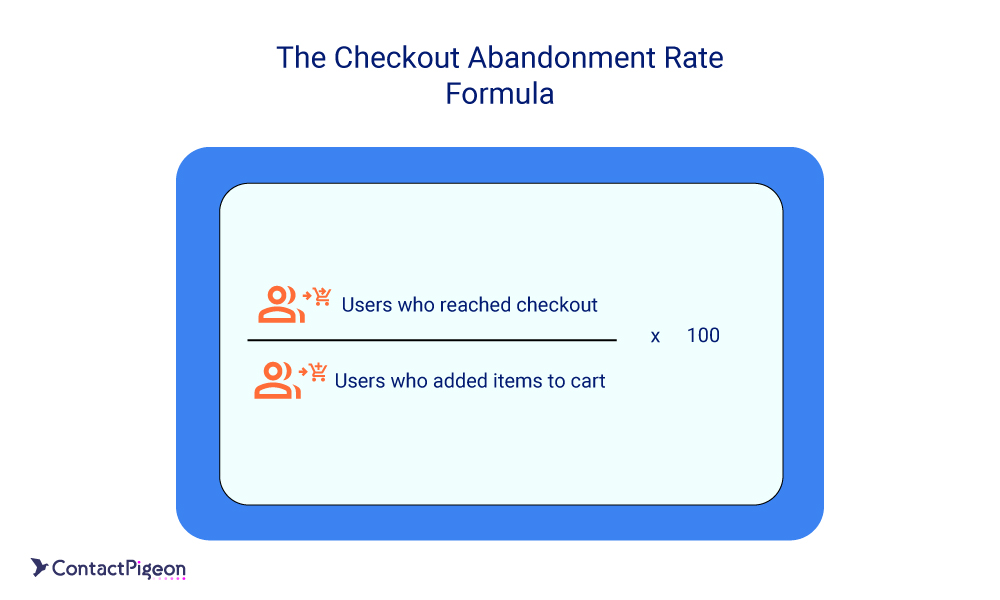
What it measures:
The percentage of users who reach the checkout page but fail to complete the purchase.
Why it’s important:
This is the core metric for understanding how many customers abandon their purchase at the final stage. A high checkout abandonment rate points to friction in the payment process, a lack of trust, or last-minute hesitation due to unclear costs or delivery terms.
How to optimize:
- Simplify the checkout process by reducing the number of steps or offering a guest checkout option.
- Optimize for mobile devices to ensure a seamless experience on all screen sizes.
- Offer multiple payment options (credit cards, digital wallets, and buy-now-pay-later services) to accommodate different preferences.
Benchmark: 60-80% (Bolt)
Useful tools:
- Customer data platforms (CDPs) for behavioral analysis
- A/B testing tools to optimize checkout flow
- Analytics platforms to track user behavior and abandonment rates.
Checkout metric #3: Checkout payment failure rate
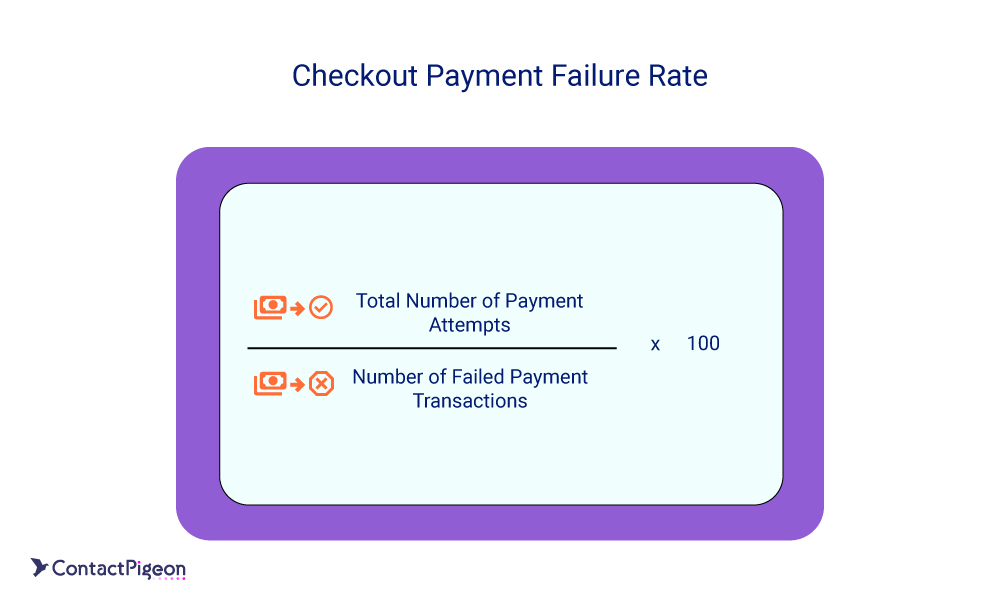
What it measures:
The percentage of transactions that fail during the payment stage due to issues like declined cards, technical errors, or incomplete payment details.
Why it’s important:
A high payment failure rate directly impacts revenue and customer trust. It may indicate technical problems with your payment gateway or limitations in the payment options offered, leading to lost sales and a poor customer experience.
How to optimize:
- Offer multiple payment gateways to ensure redundancy in case of technical failures.
- Enable real-time error notifications that inform customers immediately about any payment issues, allowing them to correct the problem.
- Streamline payment forms by minimizing the required fields and using autofill features for faster completion.
Benchmark: 5% or less (Shopify)
Useful tools:
- Payment gateway software to monitor transactions
- Fraud prevention tools to reduce false declines
- Form optimization platforms to simplify payment entry
Checkout metric #4: Time spent on checkout page
What it measures:
The average time customers spend on the checkout page before either completing the purchase or abandoning it.
Why it’s important:
Excessive time spent on the checkout page can indicate confusion or friction in the process. Long checkout times often signal complex forms, unclear instructions, or a lack of streamlined user experience, leading to higher abandonment rates.
How to optimize:
- Reduce the number of steps and form fields.
- Use progress indicators to show customers how many steps remain, giving them a clear sense of completion.
- Implement auto-fill features for address and payment information to speed up the process.
Benchmark: 64.8 seconds across industries (MetricHQ)
Useful tools:
- Session recording software to track user interaction
- Form optimization tools to simplify checkout
- UX analytics software to monitor time spent and identify bottlenecks
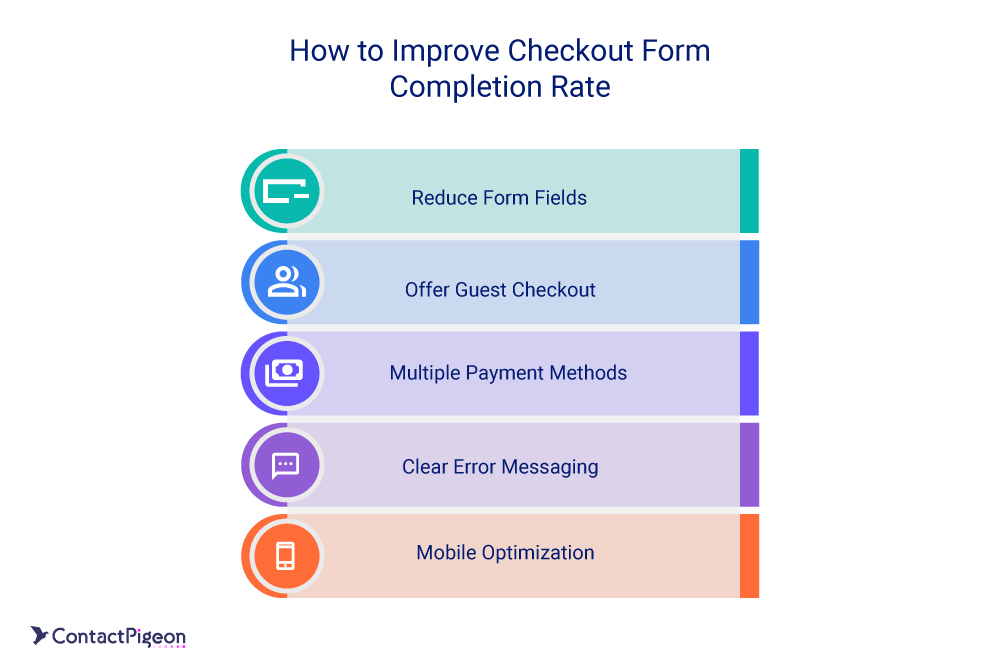
Checkout metric #5: Checkout form completion rate
What it measures:
The percentage of users who begin filling out the checkout form and successfully complete it.
Why it’s important:
This metric highlights how user-friendly your checkout form is. A low form completion rate indicates friction points, such as too many required fields, confusing instructions, or a lack of autofill options, which can lead to checkout abandonment.
How to optimize:
- Reduce the number of required fields by only asking for essential information.
- Enable guest checkout to remove barriers for new customers and speed up the process.
- Use real-time validation to help users avoid errors before submitting the form, improving the overall experience.
Benchmark: 47% (Persado)
Useful tools:
- Form analytics software to monitor completion rates
- UX testing tools to evaluate user interaction with forms
- Session replay tools to identify points of friction during form completion.
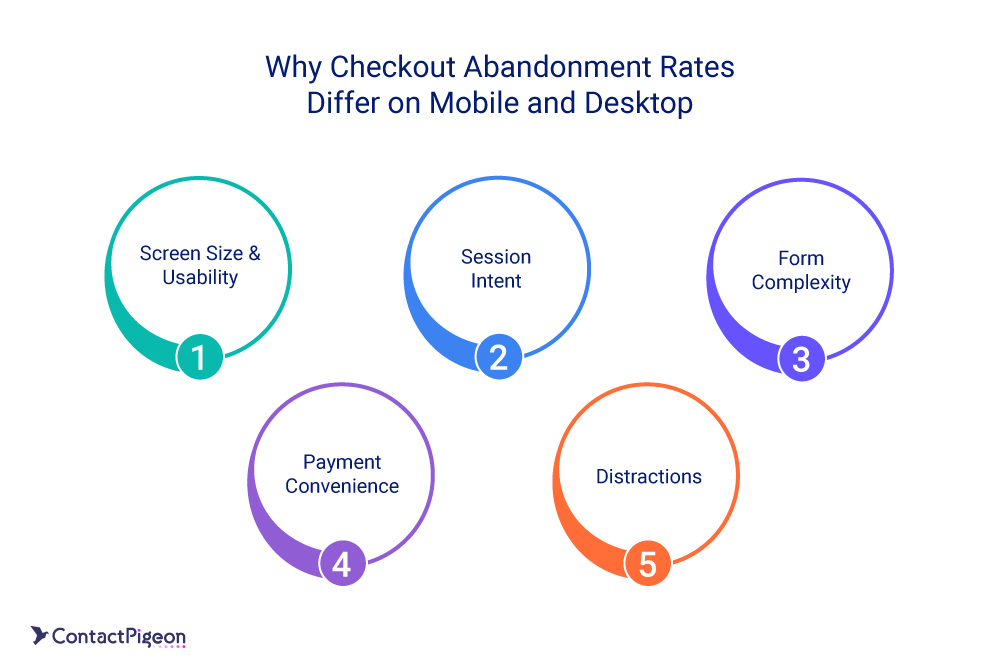
Checkout metric #6: Mobile vs. desktop checkout abandonment rate
What it measures:
The comparison of checkout abandonment rates between mobile and desktop users. This metric highlights how well your checkout process performs across different devices.
Why it’s important:
With mobile commerce on the rise, discrepancies between mobile and desktop abandonment rates can reveal optimization issues specific to mobile experiences, such as slower load times, smaller screen sizes, or clunky navigation. A higher mobile abandonment rate may indicate that the mobile checkout process needs improvement to better meet user expectations.
How to optimize:
- Optimize for mobile-first design, ensuring that the checkout page is responsive, fast-loading, and easy to navigate on smaller screens.
- Simplify mobile input by enabling features like one-click checkout or mobile wallet payments (e.g., Apple Pay, Google Pay).
- Test and refine mobile performance through A/B testing to identify and resolve mobile-specific friction points.
Benchmarks:
Useful tools:
- Mobile analytics platforms to track device-specific performance
- Responsive design testing tools to ensure seamless user experiences
- A/B testing tools to compare mobile and desktop checkout experiences.
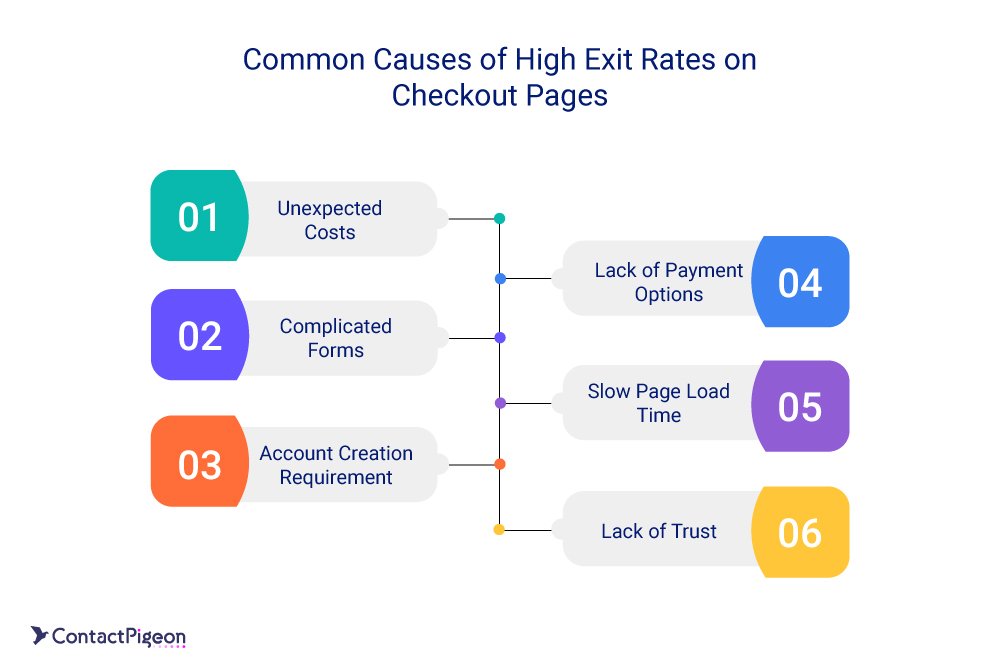
Checkout metric #7: Exit rate on checkout page
What it measures:
The percentage of users who leave the website from the checkout page without completing their purchase.
Why it’s important:
A high exit rate on the checkout page indicates that something on this critical page is causing customers to leave. It may be due to unexpected costs (e.g., shipping fees), a complicated process, lack of trust signals, or limited payment options. Understanding this metric helps pinpoint where users are dropping off and why.
How to optimize:
- Display clear pricing upfront, including shipping costs and taxes, to prevent surprise charges at checkout.
- Use trust signals like security badges and customer reviews to reinforce safety and reliability during the payment process.
- Offer multiple support options (e.g., live chat, FAQs) on the checkout page to help customers resolve any last-minute concerns.
Benchmark: around 20% to 40% (Shopify)
Useful tools:
- Web analytics software to track exit behavior
- Heatmapping tools to visualize user interaction
- User feedback tools to gather insights on why customers leave.
Checkout metric #8: Recurring vs. new customer checkout abandonment
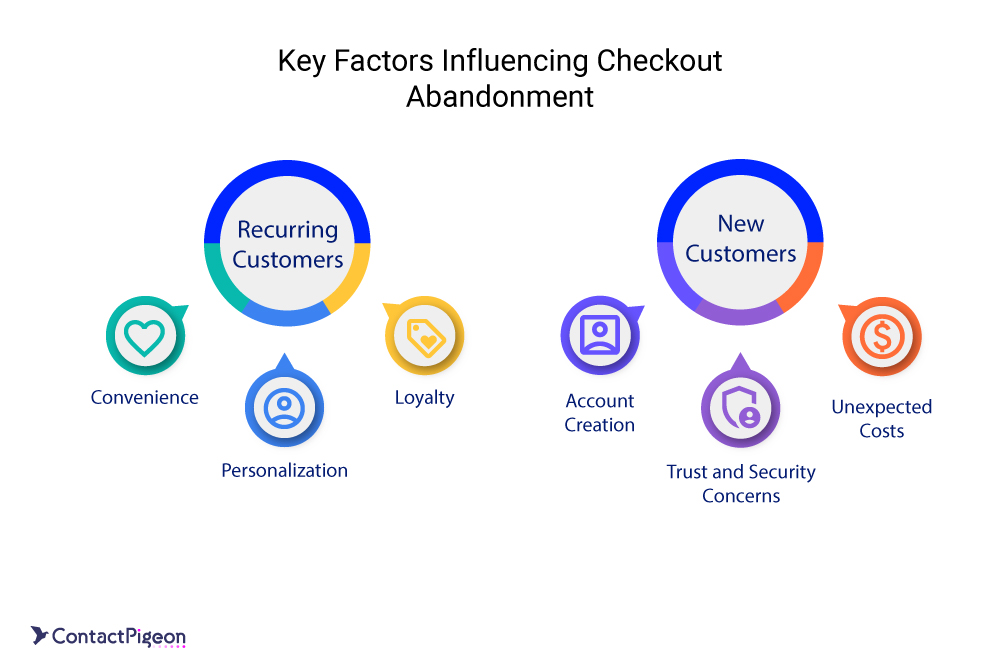
What it measures:
The comparison of checkout abandonment rates between returning customers and first-time buyers.
Why it’s important:
This metric helps you understand if there are specific issues causing new customers or loyal customers to abandon their carts at different rates. Returning customers are more familiar with your brand and checkout process, so a higher abandonment rate among them could indicate new friction points. Conversely, a high abandonment rate for new customers may signal challenges in trust, user experience, or onboarding.
How to optimize:
- Simplify account creation for new customers, or allow for guest checkout to reduce friction.
- Implement loyalty incentives for returning customers, such as saved payment information or one-click checkout options, to streamline their experience.
- Personalize the checkout experience by showing relevant product recommendations, loyalty points, or discounts for recurring customers.
Useful tools:
- Customer relationship management (CRM) software to track customer behavior
- Personalization platforms for tailored checkout experiences
- Behavioral analytics tools to compare new vs. returning customer journeys.
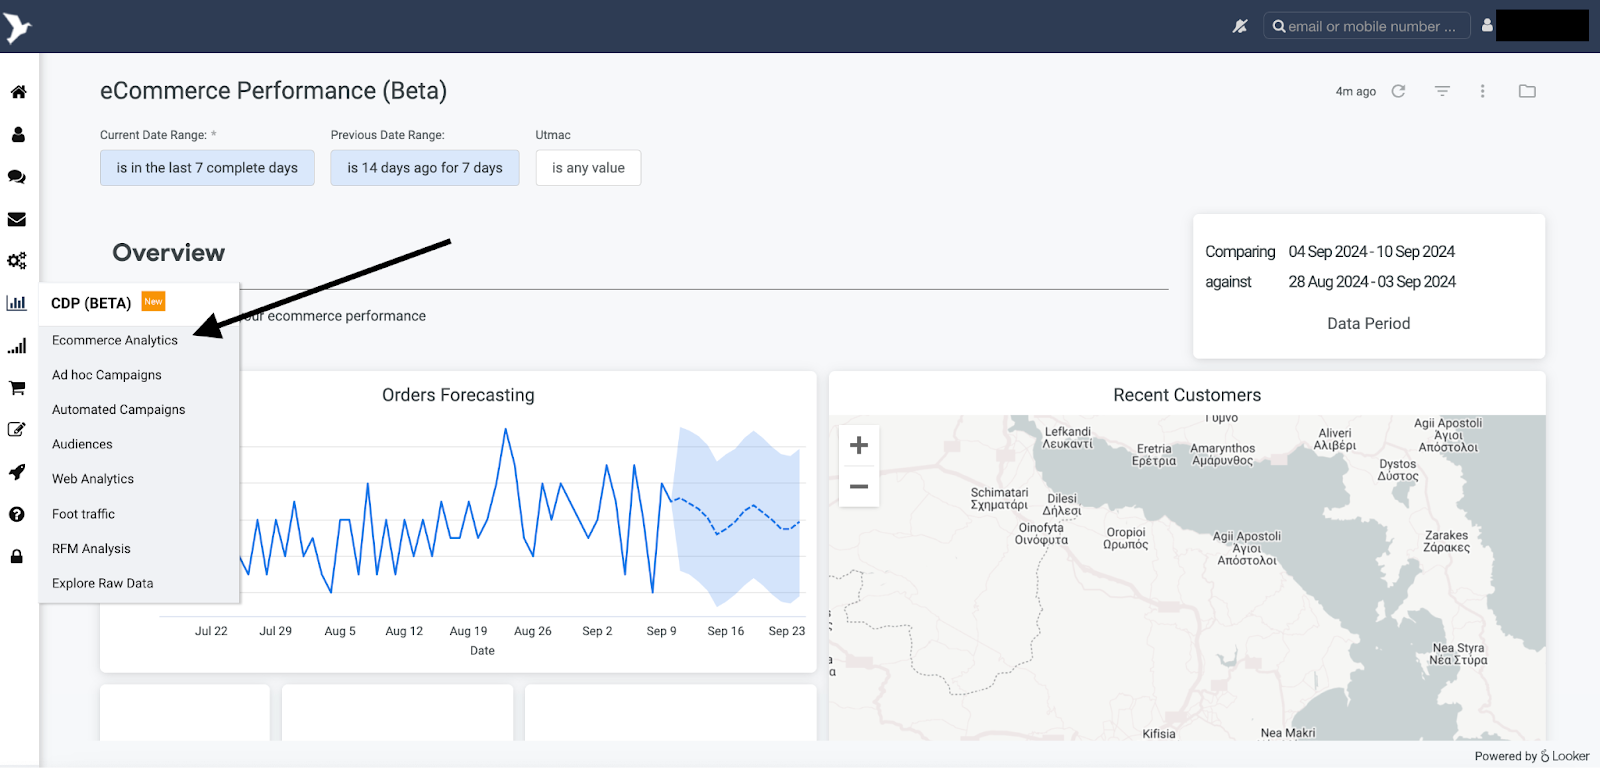
How to track your checkout abandonment metrics with ContactPigeon’s CDP
Step 1: Log in to your ContactPigeon Dashboard, search for the CDP tab and click on the “eCommerce Analytics” option.
Step 2: Then scroll down a little bit until you reach the funnel analytics diagram.
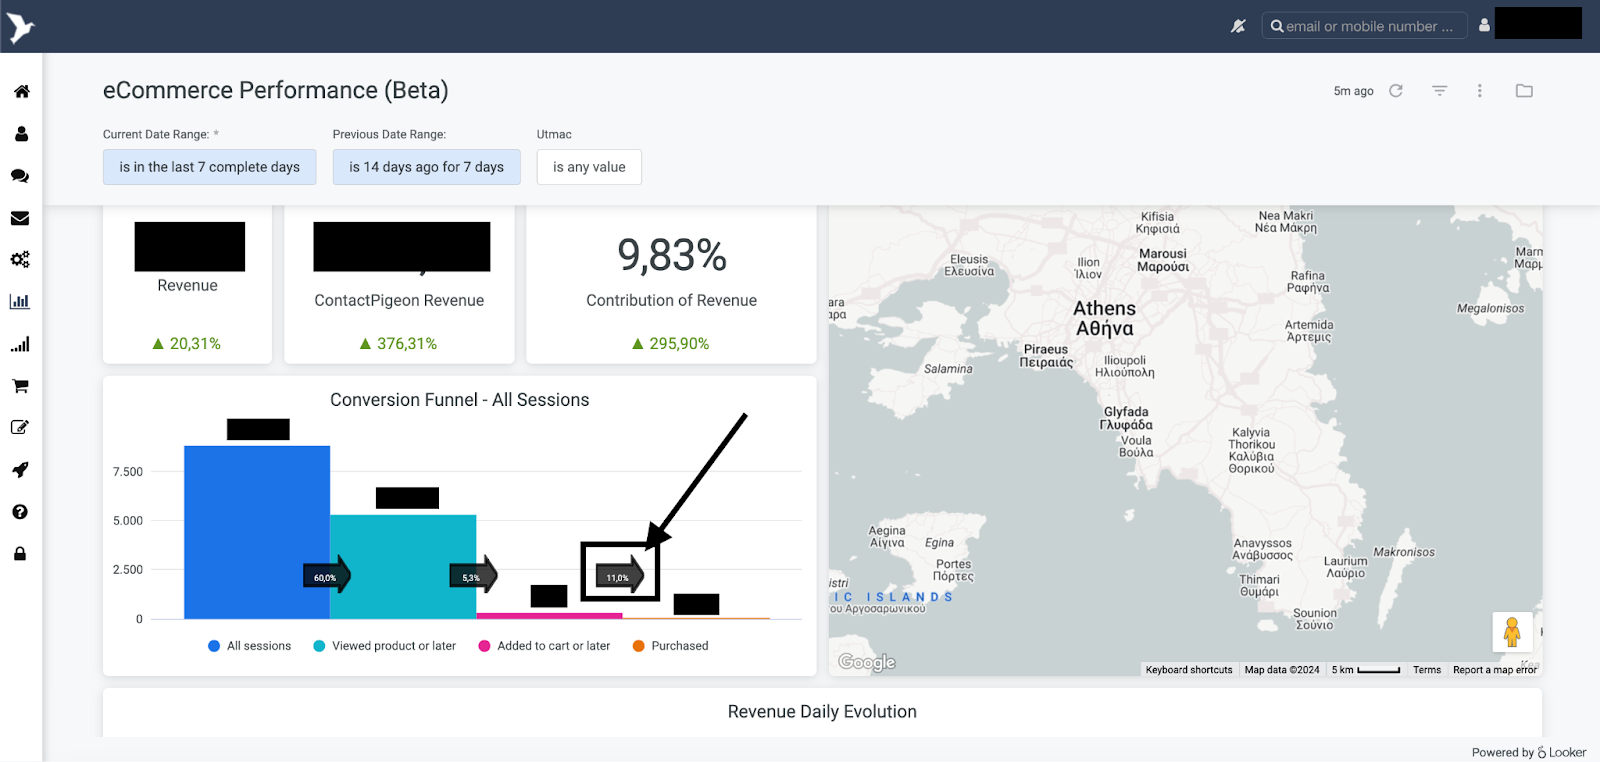
Step 3: The very last percentage of the funnel is your Cart-to-checkout conversion rate (11% in the example above).
Step 4: Calculate your Checkout Abandonment rate.
Checkout Abandonment optimization: Embed these statistics and resources on your monthly reporting process
To achieve consistent improvements in your checkout abandonment rate, it’s essential to create a monthly routine that incorporates the statistics, metrics, and insights from this article into your regular performance analysis and reporting.
- Bookmark this article
- Prepare your monthly report
- Open this guide and compare your checkout abandonment performance metrics
- Schedule optimization activities on the checkout metrics with problematic performance
- Repeat monthly and see your checkout recovery rate constantly improving
For retailers looking to effectively reduce checkout abandonment and boost conversions, implementing these strategies is key. If you’re ready to take your optimization efforts to the next level, consider reaching out for expert guidance. ContactPigeon’s team can help tailor these solutions to your unique business needs, ensuring you get the most out of your omnichannel strategy.

Let’s Help You Scale Up