

The retail business takes place where your customers are. They’re on social media, on mobile apps, and everywhere else you can imagine. But unfortunately, none of this matters if you can’t compete with other retailers in today’s omnichannel environment. That’s why 85% of marketing executives expect customer engagement metrics to be critical in choosing the right marketing strategies for their brand in 2022.
Additionally, don’t forget that in order to properly monitor your marketing efforts and define your next steps, you have to set clear and measurable goals. Therefore, we gathered the most important metrics and comprised a detailed guide that can be used as a roadmap for your data analysis.
Table of Contents
- > The Actual Meaning of Customer Engagement Metrics
- > 30 Effective Customer Engagement Metrics You Should Monitor
- > Online Customer Engagement Metrics
- > Customer Engagement Metrics and KPIs to Track per Channel in Retail
- > Offline Customer Engagement Metrics for Retailers
- > The Metrics That Suit Your Strategy
The Actual Meaning of Customer Engagement Metrics
Customer engagement metrics are a set of statistics that help retailers understand the way their customers interact with them. It’s important for every retailer to keep track of these statistics because they serve as an indicator of whether you’re succeeding in reaching your target audience and show you where you might be falling short.
That being said, you also have to avoid losing sight of the forest for the trees. Don’t get so overwhelmed with tracking customer engagement statistics that you fall into an analysis-paralysis trap.
30 Effective Customer Engagement Metrics You Should Monitor
Customer engagement is really about generating interest and enthusiasm so customers want to be associated with your brand — not just because they like your product or service, but also because they like you. Customer engagement goes beyond simple metrics like social media shares and followers. Here are the thirty most effective customer engagement metrics that can help you develop an effective customer engagement strategy.
Online Customer Engagement Metrics
#1: Net Promoter Score

How it works: The Net Promoter Score (NPS) calculates the percentage of customers who would recommend your product to a friend and the percentage who would not. The difference between these two numbers gives you the NPS, which can help you improve your customer engagement.
Why you should track it: The NPS is a measure of online engagement, tracking how likely your customers are to recommend your products or services, and why. Online businesses can use this metric to gauge customer satisfaction and loyalty and to identify opportunities to improve their offerings.
Tools or ways to track it:
- Promoter.io, an eCommerce tool that helps you manage and improve customer feedback
- SurveyMonkey, which allows you to design and send surveys to gather customer opinions
- Delighted, an eCommerce tool that helps you track customer satisfaction
#2: Customer Satisfaction Score

How it works: Your customer satisfaction score (CSAT) is a weighted average based on the percentage of customers who rate their experience with your business as either satisfied or dissatisfied. You can calculate your CSAT by taking the number of satisfied customers and dividing it by total responses, then multiplying by 100 to get a percentage.
Why you should track it: The CSAT is a crucial customer engagement measure because it represents the first step in understanding how well your business is meeting customer expectations. Many companies use CSAT as a leading indicator that measures the success of their products, services, and customer experience initiatives.
Tools or ways to track it:
- Live chat surveys asking customers to rate their satisfaction on a scale of 1 to 10 immediately after an interaction
- Survey widgets embedded into your website to collect customer feedback at various touchpoints throughout the customer journey
- Product reviews that provide valuable insight about your customers when they purchase one of your products
#3: Customer Lifetime Value

How it works: Customer lifetime value (CLV) is a measure of the total revenue that a business can reasonably expect from a single customer relationship. It includes all the future transactions a customer is likely to make, not just the ones they’ve made in the past.
Why you should track it: You need to track your CLV carefully because it helps you make informed customer engagement decisions about how you spend your marketing dollars, whom you target with your ads, and how much you can afford to pay for a new customer.
Tools or ways to track it:
- A simple average of all customers’ total purchases over time
- Adding up all monthly sales and then dividing by the number of months since the first purchase
- Repeat rate: a method that looks at CLV as a percentage of total sales and is weighted toward customers who have made repeat purchases in the past few months
Customer Engagement Metrics and KPIs to Track per Channel in Retail
Each of your marketing channels has its own metrics and KPIs that you should be tracking in order to optimize your customer engagement and business performance. Here are some of the most important ones:
#1: Google Analytics behavioral stats

This is where you can find most of your behavioral metrics, such as time spent on site, bounce rate, pages per visit, and conversion rate. Monitoring these metrics is vital so as to understand the quality of the traffic you are driving on your website.
- Bounce Rate: As Google clarifies, Bounce rate is one-page login times divided by the total number of logins or the percentage of all logins on your site in which users viewed only one page and activated only one request on the Analytics server. The lower it is, the better for your brand.
- Session Duration: The average time a visitor spends on your company’s website is a critical factor that is highly correlated with your conversion rate and revenue. If this value is bigger than 3 minutes then you should not worry.
- Pages per session: The number of pages a customer visits during a sole session. This metric should be closely monitored along with the rest behavioral stats and highlight whether the customer finds relevant and valuable content/products on your website, so as to continue his/her session and avoid abandonment.
- Conversion Rate: Depending on your analytics setup, you can and should track the new email subscribers, the number of free trial/demo requests, or the number of ebook download requests, so as to understand which channel works best for your brand.
#2: Email revenue

Email revenue is a measure of how much money is generated by email marketing through a specific channel (e.g., social networks). This metric can help you determine whether your email campaigns are performing well in terms of customer engagement.
#3: Email open rate

Your email open rate refers to how many times an email has been opened after arriving in recipients’ inboxes. The higher this number is, the more engaging your content is.

#4: Email click-through rate (CTR)

Your email click-through rate refers to the number of times a link in an email is clicked on by the recipient. This helps marketers improve their targeting for future campaigns.
#5: Push notification revenue
Retailers use this to measure mobile marketing performance and to determine the cost-effectiveness of their push notification campaigns.
#6: Push notification open rate

This is the percentage of subscribers or customers who viewed a push notification after it was sent. You can calculate it by dividing the number of users who view a message by the number of users targeted for that message.
#7: Push notification CTR
This is the percentage of users who click on a push notification after receiving it. You can calculate it by dividing the number of times a user clicks on a message by the number of users targeted for that message.
#8: SMS/messaging revenue
This KPI is used to measure the profitability and cost-effectiveness of an SMS/messaging campaign. You can calculate it by dividing the total revenue generated by messaging campaigns during a set period by the number of messages sent during that time period.
#9: SMS/messaging open rate

This metric shows what percentage of your customers open a text message that you send them. You can use it to optimize your customer engagement and messaging campaigns as you can see how many people are actually reading what you send and how many are not.
#10: SMS/messaging CTR

This metric shows what percentage of your customers click on a link provided in one of your text messages. It can be used to optimize the content and timing of your text messages as well as to measure the success of a given marketing campaign or sale.
#11: Social media marketing revenue (non-paid)
This is the amount of money you make from customers acquired through unpaid social media campaigns. This can help you identify non-optimized or ineffective marketing campaigns.
#12: Social media marketing reach (non-paid)

This is the number of people who saw your posts on social media, whether they clicked on them or not. It can include the number of likes, comments, shares, and views your posts received.
#13: Social media marketing engagement (non-paid)

This is the amount of interaction that your posts receive on social media (likes, comments, shares, and views). This is a good way to track customer engagement, by seeing how interested your followers are with your brand.
#14: Social media marketing CTR (non-paid)

This is the percentage of people who saw a link to your website on social media and clicked through to it. If this is low, it may indicate that you need more compelling content or a better call to action in order for people to click through from social media to your site.
#15: Paid ads return on ad spend (ROAS)

This is your return on ad spend for paid ads. You can calculate it by dividing the revenue generated by the amount spent on the ad. A high ROAS indicates that you are getting a lot of revenue per dollar spent on advertising.
#16: Paid ads cost per click (CPC)
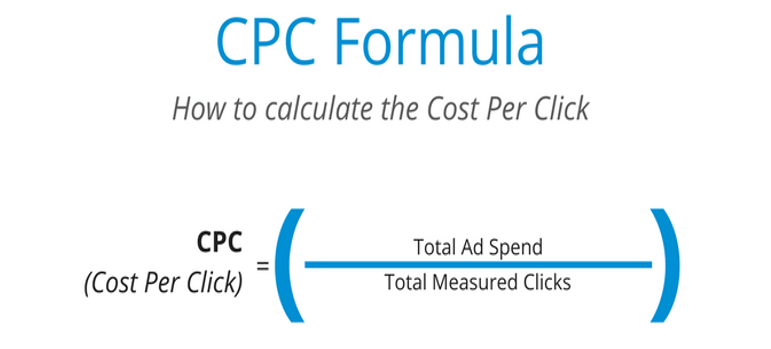
You can calculate this by dividing the total cost of the ad campaign by the number of clicks it received. If this number is too high, you may not be able to afford as much advertising as you would like.
#17: Paid ads CTR
This is the percentage of people who saw a link to your website via paid ads and clicked through to it. If this is low, it may indicate that you need more compelling content or a better call to action in order for people to click through from paid ads to your site.
#18: SEO, organic impressions
This is the number of times that search results relevant to your site were shown on the search engine results page. This helps you understand how often your website shows up in organic searches.
#19: SEO, organic clicks
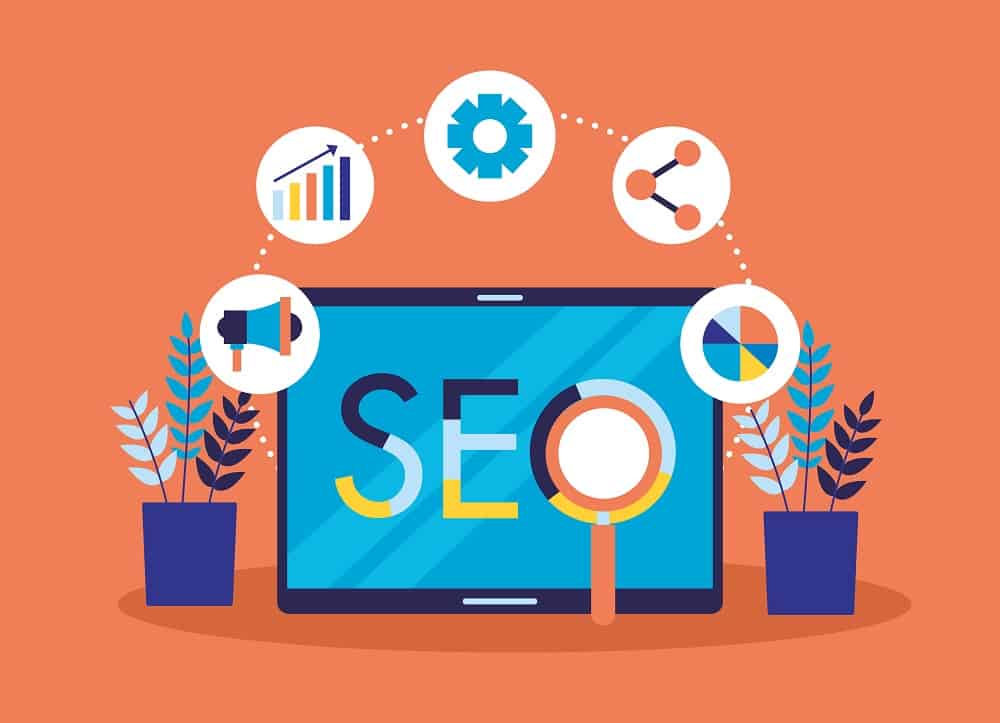
This is the number of times someone clicked on a result related to your website in an organic search. This metric allows you to understand how many people are clicking through to your website via organic search results.
#20: SEO, organic CTR
This is the percentage of people who saw a link to your website via organic search results and clicked through to it. Like with paid ads CTR, if this is low, it may indicate that you need more compelling content or a better call to action.
#21: SEO, rankings (position)

This is your average ranking for the keywords that you’re targeting. Rankings can change daily, so it’s important to track this over time and set benchmarks to keep you focused on improving your position.
#22: SEO, branded vs. non-branded traffic ratio
This is an important metric for measuring your online brand recognition. This number shows how many people are searching for your brand specifically, rather than generic phrases like “online store” or “clothing retailer.”
Offline Customer Engagement Metrics for Retailers
Many retailers do not actually implement a data-driven optimization process for their physical locations. This is 2022 and given the fact that the competition is way higher in the post-pandemic era, here is a list of the key metrics you will need to monitor on a daily, weekly, and/or monthly basis.
#1: Sales per Square Foot
How it works: Sales per square foot (SPSF) will measure the amount of revenue generated by your stores, averaged across their total square footage.
Why you should track it: This is a top-level customer engagement metric that shows you how effectively a store uses its space. The higher your sales per square foot, the more productive your store and the lower your overhead costs — in theory.
Tools or ways to track it: Use analytics tools to track floor traffic and purchases over time. Calculate your SPSF number regularly and compare it to industry benchmarks for stores similar to yours.
#2: In-Store Daily Visits

How it works: In-store daily visits, also known as foot traffic, are a key customer engagement indicator measuring how many people walk into a store on a given day.
Why you should track it: This is an important metric because it provides an approximate indicator of customer demand. The more people who visit your store, the higher your chances of making a sale.
Tools or ways to track it: Tracking customers’ devices via Wi-Fi can be used as a way of tracking their in-store behavior.
#3: In-Store Average Transaction Value
How it works: The in-store average transaction value (ATV) measures how much money each customer spends per visit. It measures the effectiveness of in-store promotion, pricing, and merchandising strategies.
Why you should track it: You can calculate the in-store ATV value by dividing total revenue by total transactions. The higher your average transaction value, the better your customer engagement performance and the more revenue you can generate per customer visit.
Tools or ways to track it: Tracking the ATV requires that you keep records of every sale and track sales by store. You can use tools like a point-of-sale system to automate this process.
#4: Inventory Turnover
How it works: Inventory turnover is a KPI that measures how well a retail store manages its inventory within a given period of time.
Why you should track it: This metric is important because it showcases how well you manage your inventory in terms of buying and selling.
Tools or ways to track it: Take the average number of days in your financial year and divide it by the number of times you replenish your inventory during that time. This will give you the average number of days required to sell all products in your store.
#5: Customer Retention Rate
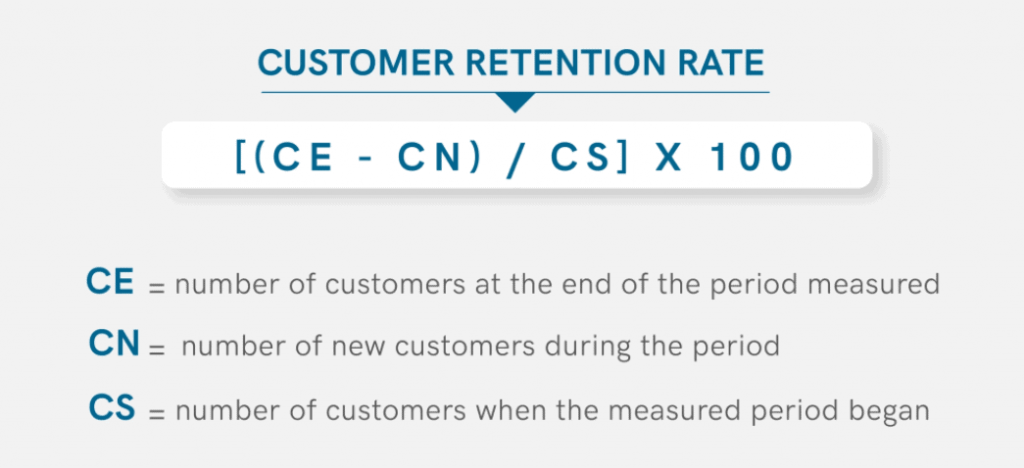
How it works: Customer retention rate is a key customer engagement indicator that looks at the percentage of customers who return to make a repeat purchase.
Why you should track it: Tracking this is important because it helps retailers understand how loyal their customer base is, and how well they’re doing at keeping new customers.
Tools or ways to track it: You can track your customer retention rate by dividing the number of repeat customers you have over a certain period of time by the total number of individuals who shopped with you during that same period.
The Metrics That Suit Your Strategy
To be a successful retail marketer, you’ve got to keep an eye on your customer engagement metrics, adjusting your strategy accordingly. That means deciding how you’re going to measure your campaign’s effectiveness, and what numbers really matter in the long run.
The best targeting campaigns are the ones in which you focus on one metric, figure out how it can make a difference in terms of your goals, and then build your strategies around that. Your messaging will be more targeted and, thus, more effective in the end. (You can grab some inspiration from the best customer engagement examples here btw).
Of course, you will need a powerful customer engagement platform ideally built for the retail industry in order to be able to coordinate a 360-degree omnichannel strategy, so you could start your research in case you haven’t already.
ContactPigeon’s customer support service surpasses the usual impersonal practices by providing monthly coordinating calls. Together we can monitor your campaigns, and establish clear goals that will make your brand profit and grow. Book a 30min free consultation call today and our account executives will walk you through the process.

Let’s Help You Scale Up