

Target offers one of the clearest examples of how a legacy retailer can evolve into a modern omnichannel operator without abandoning the scale advantages of its physical footprint. At the core of this transformation is a coordinated target marketing strategy that ties stores, digital demand, loyalty, fulfillment, marketplace expansion, and retail media into a single growth system, rather than relying on a single lever.
This case study examines how that system is structured. From Target’s performance trajectory and business model to its omnichannel architecture, growth engines, and eCommerce experience, the analysis shows that the brand’s strength lies less in isolated tactics and more in its ability to align commercial strategy, customer data, and operational execution at scale. For retail leaders, the value of Target’s example is not just in what it achieved, but in what this target marketing strategy reveals about where competitive advantage in retail is increasingly being built.
Performance timeline of Target
This timeline covers fiscal 2015–2025 and focuses on the three dimensions most visible in public filings: scale (net sales), physical footprint (store count), profitability (operating income), and channel mix (digitally originated sales share). These performance indicators provide essential context for understanding how the target marketing strategy has evolved alongside shifts in revenue, channel mix, and operational execution. All figures below are based on Target disclosures, with 2025 full-year figures taken from the company’s March 3, 2026, earnings release and historical years drawn from annual reports and SEC-filed financial tables.
Chart 1: Net sales of Target (2015-2025)
Net sales of Target (2015–2025)
Total net sales in USD billions.
Between 2015 and 2019, Target’s revenue increased from USD 73.8 billion to USD 78.1 billion, reflecting steady but moderate growth of approximately 5.8 percent over four years. The most significant inflection occurred between 2019 and 2021, when revenue rose from USD 78.1 billion to USD 106.0 billion, representing an increase of USD 27.9 billion or 35.7 percent in two years. Revenue peaked in 2022 at USD 109.1 billion before declining to USD 104.8 billion by 2025, a reduction of USD 4.3 billion or 3.9 percent from peak levels. This trajectory reflects how the target marketing strategy scaled effectively during demand acceleration and then adapted to a more normalized, post-peak growth environment.
This matters because it highlights a structural step-change in scale during the 2020–2022 period, followed by a stabilization phase where maintaining revenue becomes more critical than accelerating growth.
Chart 2: Store count of Target (2015–2025)
Store count of Target (2015–2025)
Number of Target stores over time.
Between 2015 and 2020, Target expanded its store network from 1,792 to 1,897 locations, adding 105 stores over five years. From 2020 to 2025, the footprint increased further to 1,995 stores, representing an additional 98 locations. Overall, between 2015 and 2025, Target added 203 stores, equivalent to approximately 11.3 percent growth in total footprint. This consistent expansion shows that the target marketing strategy continues to rely on physical stores as a core asset in its broader omnichannel growth model.
This matters because it shows that physical expansion remained consistent across both pre- and post-2020 periods, indicating that store presence continued to be a core scaling lever alongside digital growth.
Chart 3: Operating income of Target (2015–2025)
Operating income of Target (2015–2025)
Operating income in USD billions.
Between 2015 and 2017, operating income declined from USD 5.53 billion to USD 4.31 billion, a decrease of USD 1.22 billion or 22.0 percent. Profitability then increased significantly between 2020 and 2021, rising from USD 6.54 billion to USD 8.95 billion, an increase of USD 2.41 billion or 36.8 percent. This was followed by a sharp drop in 2022, when operating income fell to USD 3.85 billion, a decline of USD 5.10 billion or 57.0 percent year over year. From 2023 to 2025, operating income stabilized at USD 5.1–5.7 billion. This volatility highlights how the target marketing strategy operates within a margin-sensitive model, where growth and profitability do not always move in parallel.
This matters because it shows that profitability did not follow the same trajectory as revenue, introducing a second layer of performance complexity driven by margin volatility rather than scale alone.
Chart 4: Digitally originated sales share of Target (2019–2024)
Digitally originated sales share of Target (2019–2024)
Share of merchandise sales initiated through digital channels.
Between 2019 and 2020, digital sales penetration increased from 8.8 percent to 17.9 percent, a rise of 9.1 percentage points. The share continued to grow to 18.9 percent in 2021. From 2022 to 2024, digital penetration remained relatively stable, fluctuating between 18.3 percent and 19.6 percent, with a slight increase of 1.3 percentage points from 2023 to 2024. This shift reflects how the target marketing strategy successfully scaled digital demand and sustained it as a core component of the retailer’s omnichannel mix.
Data note: A comparable full-year 2025 digital share figure is not publicly disclosed in the available reporting.
This matters because it demonstrates a permanent shift in channel mix, where digital demand scaled rapidly and then plateaued at a higher baseline rather than reverting to pre-2020 levels.
Disclosure note
Target provides consistent multi-year disclosures across revenue, store count, operating income, and digital sales share through annual reports and investor materials. However, certain metrics, such as full-year 2025 digital sales share, are not publicly disclosed in a directly comparable format, limiting full-period continuity for that specific chart.
Business model decoded: Target’s retail strategy explained
Target operates a mass retail model combining owned-brand merchandising with national brands across a large-format store network and integrated digital channels. At the center of this model is a highly coordinated target marketing strategy that aligns merchandising, customer data, and channel execution. The core economic lever of Target’s retail strategy is scale-driven margin optimization through private label penetration, inventory turnover, and store-led fulfillment.
Business model snapshot
| Dimension | Target Reality | Evidence / Source |
|---|---|---|
| Core value proposition | Affordable, design-led assortment across essentials and discretionary categories. | Target annual reports and investor presentations. |
| Assortment model | Large multi-category assortment combining owned brands with national brands across apparel, home, beauty, food, and essentials. | Target filings; Target states it operates more than 40 owned brands. |
| Primary revenue streams | Primarily merchandise sales through stores, with digital sales representing a secondary but material share of total sales. | Target 2024 Annual Report; digitally originated sales accounted for 19.6% of merchandise sales in 2024. |
| Margin profile | Operating income has been positive throughout the period reviewed, but with notable volatility between peak and reset years. | Target annual reports 2021–2025; operating income ranged from USD 3.85bn to USD 8.95bn. |
| Cost intensity | High exposure to inventory, store labor, occupancy, supply chain, and markdown pressure. | Target financial disclosures and management commentary. |
| Key constraints | Heavy dependence on the US market and a large physical store base, with profitability sensitive to cost inflation and inventory misalignment. | Target SEC filings and annual reports. |
Value creation logic
- Target’s customer value proposition combines price accessibility with differentiated design, supported by owned brands such as Good & Gather and Cat & Jack.
- Assortment strategy blends private-label margin control with national-brand traffic drivers, enabling both differentiation and volume stability.
- Compared to peers, Target occupies a position between discount retailers (price-led) and department stores (brand-led) through a hybrid assortment structure (as reflected in filings and the assortment mix).
Value capture & economics
- Operating income ranged from USD 3.85bn to USD 8.95bn between 2021 and 2025, indicating variability in margin performance rather than stable margin expansion (Target Annual Reports).
- Major cost drivers include inventory procurement, markdowns, store labor, and fulfillment logistics, all disclosed as key expense categories in filings.
- Value capture relies on private label margins and high sales volume, rather than premium pricing, consistent with mass retail economics.
Scale effects & structural advantages
- Target operates nearly 2,000 stores in the US, providing national scale and supplier leverage (Target 2025 disclosures).
- Store network enables fixed-cost absorption across high sales volumes, improving efficiency at scale (observable in revenue vs footprint stability).
- Owned brands provide margin control and differentiation, reducing reliance on third-party suppliers compared to fully branded retailers (Target filings).
Structural limits & trade-offs
- The business model carries high fixed costs tied to real estate, labor, and inventory, creating sensitivity to demand fluctuations.
- Growth is structurally constrained by US market concentration, with no large-scale international expansion disclosed.
- There is a recurring trade-off between maintaining competitive pricing and protecting margins, particularly visible during periods of cost inflation and inventory adjustments (2022–2023 performance).
Omnichannel architecture: Target’s online-to-offline retail strategy
Target’s omnichannel model is designed to deliver a seamless omnichannel customer experience by connecting digitally initiated demand with a store-based fulfillment network across the US. As part of its broader target marketing strategy, this approach ensures that customer demand, data, and fulfillment are tightly coordinated across channels. The backbone of Target’s retail strategy is a store-centric fulfillment architecture, where physical locations operate as primary inventory and last-mile nodes.
Channel & inventory connectivity
- Target operates a store-led inventory model, in which stores serve as fulfillment nodes in addition to distribution centers.
- The company supports multiple fulfillment paths, including Order Pickup, Drive Up, same-day delivery (Shipt), and ship-from-store.
- A large share of digital orders is fulfilled through stores rather than centralized warehouses, indicating decentralized fulfillment execution.
Customer identity & data continuity
- Target uses an account-based identity system tied to Target Circle, enabling customer recognition across channels.
- Customer interactions across app, website, and in-store purchases can be linked through logged-in accounts and loyalty participation.
- The extent of real-time identity synchronization across systems is not publicly disclosed.
Order orchestration & fulfillment logic
- Target prioritizes store-based fulfillment for digitally originated orders, with stores fulfilling the majority of those sales.
- Target’s fulfillment architecture supports Order Pickup, Drive Up, and Shipt as store-connected fulfillment paths.
- Specific order-routing logic is not publicly disclosed. The public filing confirms the store-led model, but not the routing rules themselves.
Architectural trade-offs
- The architecture prioritizes speed of fulfillment via store proximity, increasing system complexity across inventory nodes.
- Store-led fulfillment incurs higher per-order operational costs than centralized distribution models.
- Dependence on a large physical footprint creates exposure to fixed costs and limits international scalability.
Analysis of Target’s growth marketing strategy
Target’s growth marketing strategy is built around owned audience expansion, ecosystem monetization, and repeat purchase acceleration. At the core of this approach is a highly structured target marketing strategy, with the strongest signals concentrated in loyalty, membership, retail media, and marketplace growth over the last 12–24 months.
| Growth engine | Objective | Primary KPIs | Last 12M signal | Owner |
|---|---|---|---|---|
| Target Circle loyalty | Acquire and retain identifiable shoppers | New members, trips, loyalty penetration | +13M members added in 2024 | Target Circle |
| Target Circle 360 membership | Increase retention and paid membership revenue | Membership revenue, same-day delivery growth | Membership revenue more than doubled YoY in 2025-Q4 | Target Circle 360 |
| Same-day delivery tied to membership | Lift frequency and convenience-led repeat orders | Same-day delivery growth, digital comp sales | +35% YoY in 2025-Q3; +30% YoY in 2025-Q4 | Shipt + Target Circle 360 |
| Roundel retail media | Monetize audience and vendor demand | Media value, vendor count, growth rate | Nearly USD 2bn value in 2024; double-digit growth in 2025-Q3 and 2025-Q4 | Roundel |
| Target Plus marketplace | Expand digital assortment and partner-funded growth | GMV growth, partner count, marketplace revenue | GMV +20% in 2025-Q1; nearly +50% in 2025-Q3; revenue +30%+ in 2025-Q4 | Target Plus |
| Target Circle Week | Drive member acquisition and promotional demand spikes | Discount depth, event length, member offer take-up | 7-day event in 2025-07 with up to 50% off; Circle 360 sold at 50% off | Target Circle + merchandising |
| Holiday social campaign | Build reach and seasonal demand | Social mentions/views, search interest | 70M+ TikTok mentions/views in 2024 holiday season | Brand marketing |
Target circle loyalty
- Target added more than 13 million Target Circle members in 2024, making loyalty the clearest recent first-party audience growth engine.
- The 2024 relaunch also delivered more than 1 million new members in 2024-Q1 after the new program structure went live.
- Public disclosures tie Circle directly to value and relevance, but consent rate, active-member rate, and loyalty share of sales are not publicly disclosed.
- In short, loyalty is Target’s primary owned-audience growth engine.
Target circle 360 membership
- In 2025-Q4, Target said membership revenue more than doubled year over year, making paid loyalty one of the fastest-growing non-merchandise lines.
- In 2025-03, the company said it aims to triple the Target Circle 360 member base over three years, showing management is treating paid membership as a core growth lever.
- The proposition widened in 2025-05 when Circle 360 added same-day delivery with no price markups across 100-plus retailers, strengthening the upsell case beyond Target-only benefits.
- In short, paid membership is being scaled as a retention and monetization layer.
Same-day delivery tied to membership
- In 2025-Q3, Target reported digital comp sales up 2.4%, led by more than 35% growth in same-day delivery powered by Target Circle 360.
- In 2025-Q4, the company again cited 30%+ growth in same-day delivery powered by Circle 360.
- This is a growth signal for engagement and repeat purchase, but order frequency, CAC, and margin by delivery cohort are not publicly disclosed.
- In short, membership-linked convenience is supporting repeat digital demand.
Roundel retail media
- Target said Roundel delivered nearly USD 2 billion in value in 2024, giving the company a sizable media-funded growth engine tied to first-party shopper data.
- The company reported double-digit growth for Roundel in both 2025-Q3 and 2025-Q4.
- Roundel works with 2,000+ vendors and reaches shoppers on Target-owned properties plus 150+ premium publishers, indicating that the network spans on-site and off-site media.
- Public materials describe advertiser ROI positively, but public ROAS, CPM, or incrementality-test results are not disclosed.
- In short, retail media is now one of Target’s clearest growth and profit engines.
Target plus marketplace
- In 2025-Q1, Target said Target Plus GMV grew more than 20%, with hundreds of new partners added.
- In 2025-Q3, the company reported Target Plus GMV up nearly 50% year over year.
- In 2025-Q4, Target said marketplace revenue grew more than 30% year over year.
- This engine broadens acquisition and monetization through partner assortment, but paid affiliate economics and marketplace take rate are not publicly disclosed.
- In short, the marketplace is a fast-growing partner-led traffic and monetization channel.
Target circle week
- In 2025-07, Target ran a 7-day Circle Week event with discounts of up to 50% off and 24-hour early access for Circle 360 members.
- During that same event, Circle 360 membership was promoted at 50% off, showing that Target uses promotional tentpoles to acquire both free and paid members.
- In 2025-10, the fall Circle Week returned as a 7-day event with a “Deal of the Day” up to 40% off and broader member perks.
- Public disclosures do not provide event ROAS, incremental trips, or member conversion rate.
- In short, Target uses membership-gated promo events to stimulate demand and sign-ups.
Holiday social campaign
- Target’s 2024 holiday campaign generated more than 70 million TikTok mentions/views of #TargetSanta, giving the brand one of its clearest recent organic-reach signals.
- The same campaign was described as one of TikTok’s top searches during Black Friday week, indicating unusually high seasonal search and social visibility.
- Target extended that creative platform into 2025 through new Kris K. campaign work and product collaboration, showing the brand is operationalizing social attention into repeatable seasonal creative.
- Public disclosures do not show direct sales attribution, CPA, or lift-test results for the campaign.
- In short, seasonal creative is a proven reach engine, but public attribution is limited.
Analysis of the eCommerce strategy of target
Target’s retail strategy in eCommerce leans on broad category access, dense product information, and promotion-first merchandising, with public evidence strongest on structure and sitewide performance rather than conversion. As part of the broader target marketing strategy, this approach prioritizes discoverability, merchandising control, and demand capture across a high-volume digital environment.
| Area | Strength / Issue | Why it matters | Metric / Evidence | Owner |
|---|---|---|---|---|
| Home | Strong category discoverability | Reduces navigation friction and improves entry into catalog | 30+ nav links visible, crawl 2026-03 | Growth / Design |
| Home | High promo density | Competes for attention above the fold | 8+ promo tiles visible, 2026-03 | Merchandising |
| Home | CWV performance moderate | Impacts bounce and SEO ranking | LCP 2.7s, CLS 0.15, INP 175ms (2026-02) | Engineering |
| PLP | Strong filtering system | Improves product discovery in large catalogs | 9 filters, 177K+ results, 2026-03 | UX / SEO |
| PLP | Heavy product badges | Reduces scan clarity in dense grids | Multiple overlays per product card, 2026-03 | Merchandising |
| PDP | High product detail depth | Supports conversion and reduces uncertainty | 179 reviews, 19 Q&A, 18 sizes, 2026-03 | Product Content |
| PDP | Content inconsistency risk | Impacts trust and return rates | User-reported size mismatch, 2026-03 | QA / Merchandising |
| Checkout | Account required | Adds friction vs guest checkout | Login required per help docs, 2026-03 | Product |
| Checkout | Order splitting complexity | Reduces clarity at purchase stage | Multiple order numbers generated, 2026-03 | Product / Ops |
Home page analysis
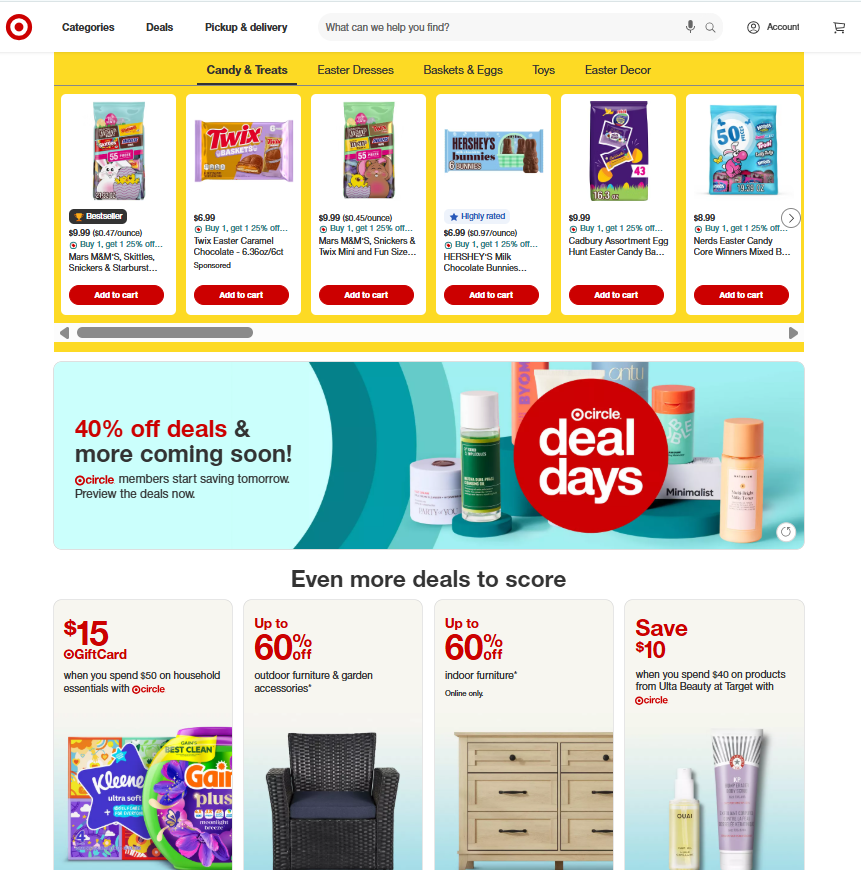
What we liked
- The homepage exposes 30+ top-level navigation links before the main content modules, including apparel, grocery, beauty, electronics, deals, loyalty, and store services, which support fast category entry on large assortments.
- “Featured categories” adds 16 shortcut links below the hero modules, giving the page a second discovery layer beyond the global nav.
What we didn’t
- The page is promotion-heavy. In a single crawl, “Even more deals” alone contained 8 offer tiles, on top of a hero promo, loyalty banner, and card-rewards banner. That creates message competition above the fold.
- The homepage foregrounds seasonal and promotional content over the evergreen informational hierarchy. In the first visible modules, Easter, Circle Deal Days, card rewards, and spring collections appear before deeper category education.
Category page analysis (PLP)
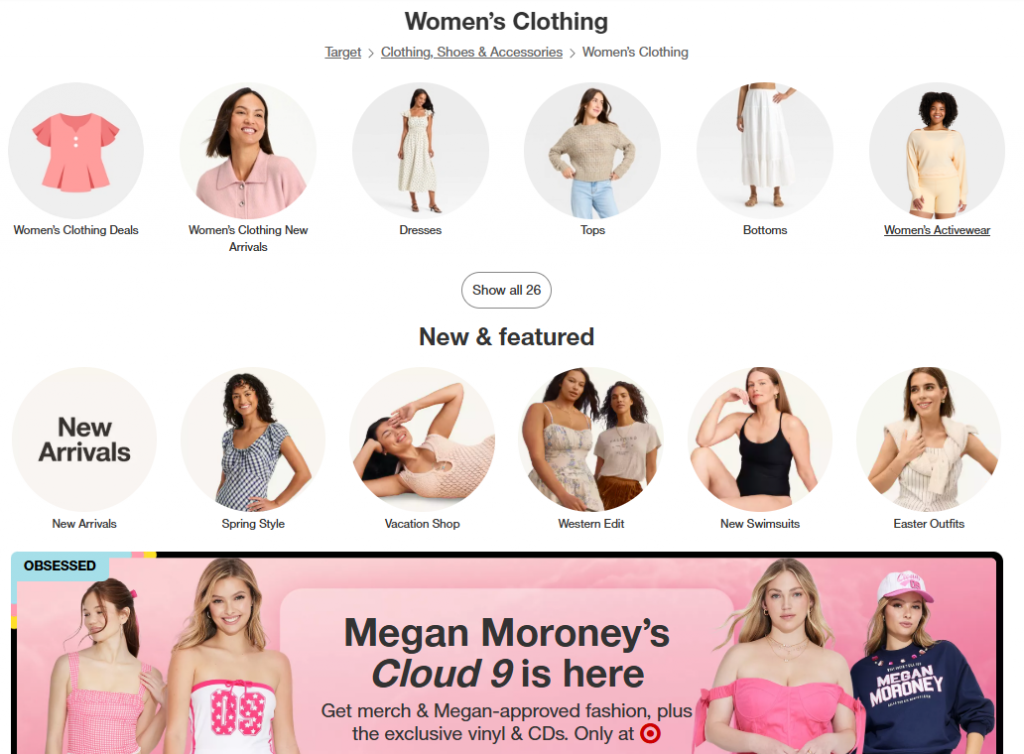
What we liked
- The page supports deep category exploration with visible sub-navigation (e.g., Dresses, Tops, Bottoms, Activewear) and a “Show all 26” option, reducing navigation depth for large catalogs.
- Strong merchandising layering through “Trending now”, “New & featured”, and seasonal edits, creating multiple entry paths into the catalog.
- High product discoverability via dense grid layout (6 products per row desktop) with visible price, discounts, and CTAs directly on cards.
What we didn’t
- Visual hierarchy is fragmented due to multiple competing modules (Trending, Newness, Brands, UGC) before and between product listings.
- Horizontal scrolling modules (e.g., Trending carousel) introduce interaction friction compared to vertical browsing patterns.
- Brand section (“Only at Target”) uses logo-based navigation without product previews, reducing immediate shopping intent.
Product page analysis (PDP)
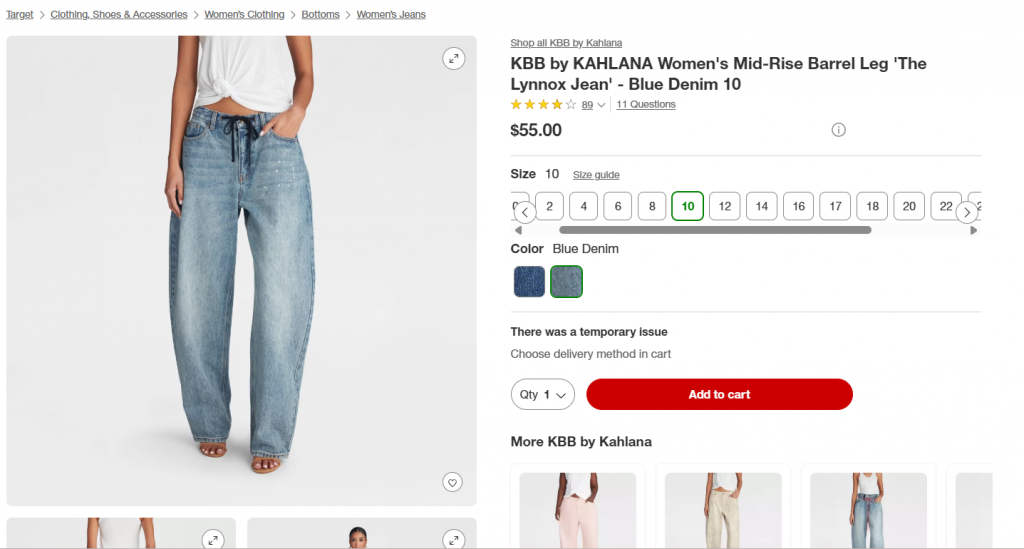
What we liked
- Strong product detail depth with reviews, Q&A entries, and structured size selection, supporting informed purchase decisions.
- Clear pricing and financing transparency with the price and pay in installments, and Target Circle incentives visible above the fold.
- High trust signals embedded early: star rating, review count, return policy (365 days), and stock visibility.
- Structured product information architecture with expandable sections (Description, Size Guide, Specifications), improving scannability.
What we didn’t
- Visual content is limited relative to category expectations: ~4–5 images and no visible video, which is below best-in-class fashion PDP benchmarks (8–10+ media assets).
- Variant selection UX introduces friction: horizontal scrolling size selector (0–22) increases interaction cost on both desktop and mobile.
- Error state handling impacts conversion: “This combination isn’t available” + “Find alternative” CTA interrupts purchase flow instead of guiding to in-stock variants.
- Content consistency risk: size/fit clarity relies on static tables, while user feedback highlights fit variability, creating potential return friction.
Cart checkout flow analysis
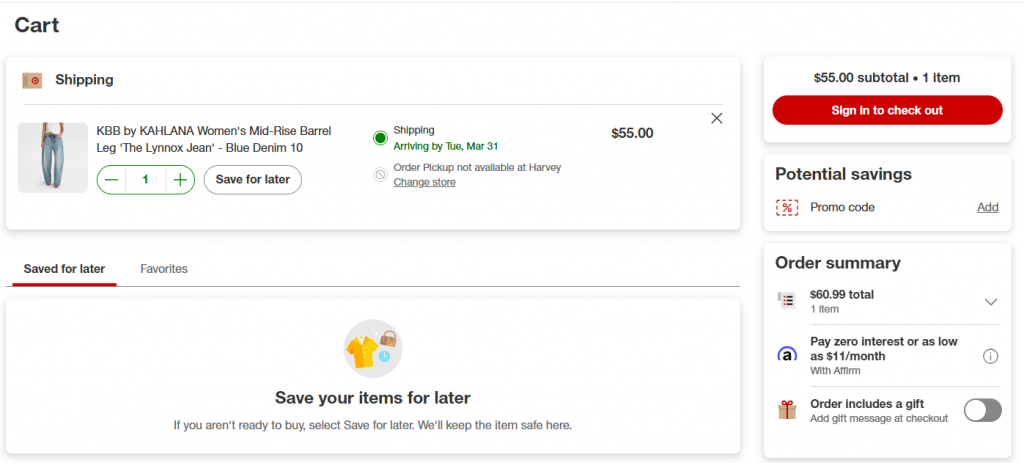
What we liked
- Clear pricing transparency early in the flow: subtotal vs total (incl. taxes) visible before checkout, reducing price shock risk.
- Strong order visibility with delivery ETA and fulfillment type (Shipping) shown at the cart level.
- An additional monetization layer was introduced early with Affirm financing ($11/month) presented in the cart stage.
- Gift-card usage is flexible: shoppers can apply up to 10 Target GiftCards to an order.
What we didn’t
- Checkout gated behind account: “Sign in to check out” is the primary CTA, adding friction vs guest checkout benchmarks.
- The promo code field is surfaced prominently under “Potential savings,” which can trigger coupon-seeking behavior and delay checkout progression.
- Cart introduces multiple secondary actions (Save for later, Favorites, Gift options), increasing cognitive load at a critical conversion step.
- Fulfillment limitation messaging (“Order Pickup not available at selected store”) appears without proactive alternatives, creating dead-end friction.
Target’s marketing strategy resources: Best videos to watch.
Curated video content provides direct access to how Target’s marketing strategy is articulated by executives and analysts, offering valuable context on its growth, media, and brand-building decisions. These perspectives help illustrate how the target marketing strategy is communicated, executed, and evolved at the leadership level.
1. Target on Turning Strategy into Action
2. Media & Merchandising Integration with Roundel’s Matt Drzewicki
3. Target CEO Brian Cornell Breaks Down The Retail Giant’s Digital Strategy | CNBC
4. Roundel’s VP of Roundel Partner Solutions, Matt Drzewicki, In The C Space Studio – CES 2025
5. Target Store Tour With New CMO Jeff Jones
Target: The most impressive statistics of the mass retailer
These figures provide a concise, data-driven snapshot of Target’s scale, growth trajectory, and strategic positioning within the global mass retail landscape, offering measurable context for how the target marketing strategy translates into performance at scale.
Stat 1: Revenue scale
Metric: USD 104.8bn revenue
Period: FY2025
Context: Positions Target among the largest mass retailers globally by sales.
Source: Target Annual Report, 2026
Stat 2: Peak revenue expansion
Metric: USD 109.1bn revenue
Period: FY2022
Context: Marks the company’s highest recorded sales level following pandemic-driven demand.
Source: Target Annual Report, 2023
Stat 3: Store footprint
Metric: 1,995 stores
Period: 2025
Context: Reflects near-national physical coverage across the United States.
Source: Target Corporate Disclosure, 2026
Stat 4: Digital Sales Penetration
Metric: 19.6% of total sales digitally originated
Period: FY2024
Context: Indicates sustained channel shift compared to pre-2020 levels (~9%).
Source: Target Annual Report, 2025
Stat 5: Operating income volatility
Metric: USD 3.85bn to USD 8.95bn operating income range
Period: 2021–2025
Context: Highlights margin sensitivity despite stable revenue scale.
Source: Target Annual Reports, 2022–2026
Stat 6: Same-day fulfillment frowth
Metric: +35% YoY growth
Period: 2025-Q3
Context: Signals increasing reliance on fast fulfillment as a growth driver.
Source: Target Earnings Release, 2025
Stat 7: Retail media scale (Roundel)
Metric: ~USD 2bn media value
Period: FY2024
Context: Establishes Target as a scaled retail media operator, not just a retailer.
Source: Target Annual Report, 2025
Stat 8: Marketplace growth (Target Plus)
Metric: ~50% GMV growth
Period: 2025-Q3
Context: Indicates rapid expansion of third-party assortment and partner-driven sales.
Source: Target Earnings Materials, 2025
Stat 9: Loyalty expansion
Metric: +13 million Target Circle members added
Period: 2024
Context: Demonstrates acceleration in first-party customer base growth.
Source: Target Corporate Announcement, 2025
Latest news on Target
Recent developments highlight Target’s strategic recalibration, with a focus on operational efficiency, new growth engines, and structural changes across its commercial and organizational model. These shifts provide important context for how the target marketing strategy continues to evolve in response to market pressure and long-term growth priorities.
1: Target launched a new multi-year growth plan built around same-day services, memberships, marketplace, and retail media
Target said it aims to add more than USD 15 billion in sales by 2030, with growth priorities including Target Circle 360, same-day services, Target Plus, and Roundel.
- This formalized a portfolio shift toward higher-frequency, higher-margin growth engines beyond traditional merchandise sales.
- For marketing leaders, it confirms that loyalty, marketplace, and retail media are now central to Target’s commercial model.
Source: Target
Date: 2025-03-04
2: Target created an Enterprise Acceleration Office and reshuffled top leadership
Target announced a multi-year Enterprise Acceleration Office, moved CFO Jim Lee into oversight of enterprise strategy and partnerships, gave Rick Gomez oversight of enterprise insights, and said Chief Strategy and Growth Officer Christina Hennington would depart and remain as an advisor through September 2025.
- This was a structural reorganization aimed at speeding decision-making and tightening execution across strategy, insights, partnerships, and technology.
- For executives, it signaled that Target saw organization design itself as part of the turnaround agenda.
Source: Target
Date: 2025-05-06
3: Target’s 2026 outlook showed continued pressure despite a Q4 beat
In its full-year 2025 earnings release, Target issued fiscal 2026 guidance that included near-term sales and profit pressure, while also reiterating long-term growth expectations.
- The message was that Target is still in a reset period, balancing investment and growth ambitions against tariff risk and soft consumer demand.
- For CMOs and growth leaders, weaker near-term visibility usually means greater scrutiny on promotional efficiency, traffic quality, and margin protection.
Source: Target
Date: 2026-03-03
4: Target increased investment in stores, technology, and AI while sales remained under pressure
Retail Dive reported that Target planned an additional USD 1 billion of investment in 2026, bringing expected capital spending to about USD 5 billion for stores, remodels, technology, and digital fulfillment capabilities.
- This points to a strategy of funding operating improvements and tech capability during a period of weak sales, rather than cutting back to preserve short-term margins.
- It also suggests Target is treating store experience and fulfillment infrastructure as strategic assets, not maintenance spending.
Source: Retail Dive
Date: 2025-11-20
5: Target cut corporate roles while adding store labor investment
Retail Dive reported that Target cut about 500 roles and increased investment in store payroll and hours, following a larger round of corporate job cuts in 2025.
- This shows a clear reallocation of cost from headquarters toward frontline execution, which aligns with a store-led recovery thesis.
- Strategically, it suggests Target sees store standards and in-store conversion as more urgent than preserving the existing corporate structure.
Source: Retail Dive
Date: 2026-02-10
6: Target expanded next-day delivery to more metros while keeping stores central to digital fulfillment
Retail Dive reported that Target was extending next-day delivery to 20 more metro areas and said same-day services generated more than USD 14 billion last year, about two-thirds of digital sales.
- This is a material channel-development move because it expands convenience-led demand capture without abandoning the store-based fulfillment model.
- For commercial leaders, it reinforces that service-level improvements are still one of Target’s clearest levers for digital growth.
Source: Retail Dive
Date: 2026-03-10
Master the Target “Omnichannel Flywheel”
Target transformed from a legacy retailer to an eCommerce powerhouse by turning 2,000 stores into fulfillment hubs. Select a growth engine below to see the tech behind the $100B+ success.
Lessons learned from Target's marketing strategy
These lessons translate Target’s marketing strategy into transferable principles, highlighting how scale, structure, and execution discipline shape sustainable retail growth, and how a well-executed target marketing strategy can drive long-term competitive advantage.
1. Growth shifts toward owned ecosystems as scale increases
- What Target did: Built growth around loyalty (Target Circle), membership (Circle 360), retail media (Roundel), and marketplace (Target Plus).
- Why it worked: These assets compound value over time by reducing dependency on external acquisition channels.
- When this applies: Works best when a retailer has sufficient traffic and transaction volume to support first-party data ecosystems.
2. Stores remain a strategic asset when integrated into fulfillment
- What Target did: Used its ~2,000-store network as the backbone for same-day and digital fulfillment.
- Why it worked: Leveraged existing fixed assets to support digital growth without duplicating infrastructure.
- When this applies: Works when store density allows coverage within short delivery radiuses.
3. Margin expansion increasingly comes from non-product revenue streams
- What Target did: Scaled retail media and membership as parallel revenue layers alongside merchandise sales.
- Why it worked: These streams carry structurally higher margins than traditional retail.
- When this applies: Works when retailers have meaningful supplier relationships and audience scale.
4. Assortment control balances differentiation with volume stability
- What Target did: Combined private label brands with national brands across key categories.
- Why it worked: Private labels improved margin control, while national brands sustained traffic and trust.
- When this applies: Works in categories where both brand equity and price sensitivity influence demand.
5. Promotional intensity must be structurally managed, not just tactically executed
- What Target did: Embedded promotions into loyalty programs and recurring events (e.g., Circle Week).
- Why it worked: Centralizing promotions within owned channels prevents margin erosion from uncontrolled discounting.
- When this applies: Works when retailers operate in highly competitive, price-sensitive environments.
6: Organizational structure becomes a growth lever at scale
- What Target did: Introduced an Enterprise Acceleration Office and restructured leadership around strategy, insights, and execution.
- Why it worked: Faster decision-making and alignment improved the ability to execute multi-channel growth priorities.
- When this applies: Works when organizational complexity begins to slow execution across functions.
7. Growth normalization requires a shift from expansion to efficiency
- What Target did: Maintained investment in stores, technology, and fulfillment despite slower near-term growth.
- Why it worked: Positioned the business for long-term efficiency rather than short-term margin protection.
- When this applies: Works when a retailer transitions from rapid growth phases to mature scale operations.
Key takeaways from Target’s marketing and retail strategy
Target’s performance reflects a consistent pattern: growth is no longer driven by channels in isolation, but by how effectively retail infrastructure, data, and customer relationships are integrated into a single operating model. The strength of the target marketing strategy lies in aligning owned audiences, store-based fulfillment, and commercial ecosystems into a system where each layer reinforces the other.
For retail leaders, the implication is clear. Competitive advantage is shifting toward capabilities such as first-party data leverage, cross-channel orchestration, and the ability to scale new revenue layers without fragmenting execution. The challenge is less about identifying opportunities and more about building the operational discipline to activate a cohesive target marketing strategy consistently across channels.
In practice, translating these principles into execution requires coordination across data, messaging, and customer touchpoints. This is where many retailers turn to platforms like ContactPigeon when moving from strategic intent to scalable implementation.