


Ulta Beauty has become one of the most instructive case studies in modern retail, not because of any single campaign or channel, but because of how the Ulta Beauty marketing strategy structurally aligns marketing, retail operations, and customer data. In a category defined by high competition, fragmented demand, and constant trend cycles, Ulta has built a model where scale, loyalty, and omnichannel execution—supported increasingly by AI agents in cosmetic retail—reinforce each other over time.
This analysis looks beyond surface-level performance to examine how Ulta Beauty has translated marketing into a durable growth system. By connecting performance data, business model choices, omnichannel architecture, and customer engagement strategy, the goal is to extract lessons that matter to retail leaders navigating similar pressures. The result is not a playbook of tactics, but a clearer view of what it takes to build marketing effectiveness that compounds rather than resets each year.
Performance timeline of Ulta Beauty
This performance timeline provides a fact-based view of how Ulta Beauty has scaled over time across revenue, physical footprint, and profitability, offering context for the evolution of the Ulta Beauty marketing strategy. By reading these indicators together, executives can identify inflection points in growth, periods of operating leverage, and the evolving role of store productivity as the business matures.
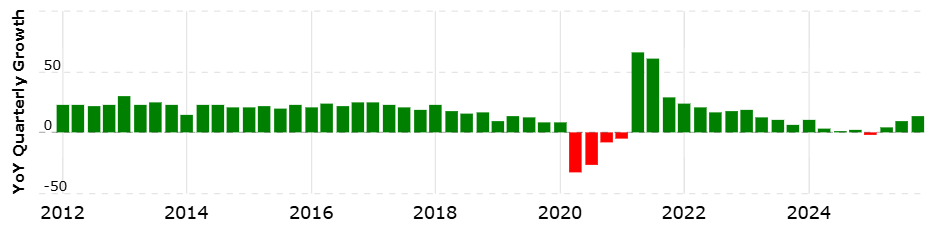
Net sales of Ulta Beauty (2012-2025)
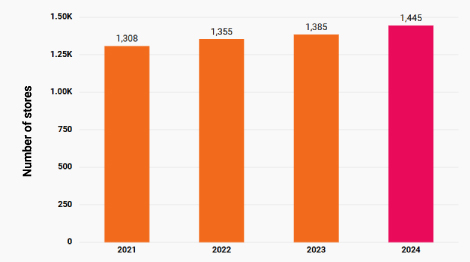
Store count of Ulta Beauty (2021-2025)
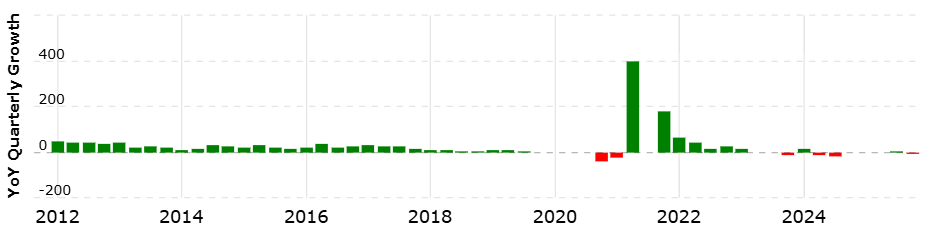
Operating income of Ulta Beauty (2012–2025)
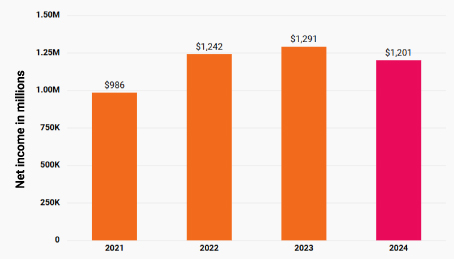
Net sales per store (2021–2025)
Business model decoded: Ulta Beauty’s retail strategy explained
Ulta Beauty is a US specialty beauty retailer that generates revenue primarily through merchandise sales across its store network and digital platforms, with additional revenue from salon services and other programs. The Ulta Beauty marketing strategy is closely tied to a retail model economically anchored in scaled assortment breadth and a store-led structure that must sustain gross margin while carrying meaningful fixed-cost exposure from stores and leases.
| Dimension | Ulta Beauty reality | Evidence / Source |
|---|---|---|
| Core value proposition | One-stop specialty beauty format spanning mass to higher-end brands plus salon services in most stores. | Ulta filings: broad selection across categories and price points; most stores feature full-service salon. |
| Assortment model | Broad, multi-category assortment with disclosed scale of SKU and brand breadth. | Ulta disclosures: ~29,000 products from ~600 brands. |
| Private label and exclusives | Private label and permanent exclusives are a small disclosed share of net sales; total exclusives also disclosed. | FY2024: Ulta Beauty Collection + permanent exclusives ~4% of net sales; total exclusives ~9%. |
| Primary revenue streams | Merchandise sales through stores and eCommerce plus salon services and other revenue. | Ulta 10-K: “Net sales include retail stores and e-commerce merchandise sales as well as salon services and other revenue.” |
| Revenue mix by category | Disclosed category mix spans cosmetics, skincare, haircare, fragrance, services, and other revenue. | FY2024 mix: Cosmetics 41%, Skincare 22%, Haircare 20%, Fragrance 11%, Services 4%, Other 2%. |
| Margin profile | Gross margin in the high 30% range; operating margin in the mid-teens. | FY2024 gross margin 38.8%; operating margin 13.9%. |
| Key constraints | Concentration in the US; vendor concentration; store lease commitments. | Top ten brand partners ~54% of net sales; operating lease liabilities PV USD 1.923bn. |
Value creation logic
- Broad assortment access across categories and price points, supported by disclosed scale of ~29,000 products and ~600 brands.
- Category breadth is structurally embedded, with disclosed net sales mix spanning cosmetics, skincare, haircare, fragrance, services, and other revenue.
- Differentiated margin levers exist but are currently disclosed as small shares, with private label plus permanent exclusives at ~4% of net sales in FY2024 and total exclusives at ~9%.
Value capture & economics
- Profitability signal: operating income margin is disclosed at 13.9% (FY2024), 15.0% (FY2023), 16.1% (FY2022).
- Major cost drivers: cost of sales 61.2% and SG&A 24.9% of net sales (FY2024).
- Margin mechanics are tied to merchandise margin, shrink, supply chain costs, and fixed store costs as described in the FY2024 margin bridge (basis-point drivers disclosed).
Scale effects & structural advantages
- Scale advantage is primarily assortment and footprint, with 1,445 stores across 50 states (as of Feb 1, 2025).
- Operating leverage is visible in the cost structure: SG&A and store payroll deleverage, and fixed store costs are explicitly discussed as margin drivers (basis points) in FY2024.
- Defensibility is partially constrained by vendor concentration, with the top ten brand partners at ~54% of net sales in FY2024.
Structural limits & trade-offs
- Fixed-cost exposure: operating lease liabilities present value USD 1.923bn (as of Feb 1, 2025) and total lease cost USD 445.8m (FY2024), with most lease cost tied to stores and distribution facilities.
- Growth constraint: financial disclosure indicates the business is currently US-generated (net sales within the US; assets primarily in the US), creating geographic concentration risk.
- The tension between profitability and growth is structurally visible in the disclosed FY2024 drivers: higher promotional activity, higher supply chain costs, and SG&A wage investments weighed on margins. At the same time, the model continued to open stores.
Omnichannel architecture: Ulta Beauty’s online-to-offline retail strategy
Ulta Beauty’s retail strategy, as part of the Ulta Beauty marketing strategy, connects digital demand (ulta.com and mobile apps) to store and DC inventory through multiple fulfillment paths (pickup, ship, same-day delivery). The architectural backbone is a hybrid fulfillment network where distribution nodes and stores both act as fulfillment points, with loyalty as the primary identity key.
| Layer | Ulta Beauty implementation | Evidence / Source |
|---|---|---|
| Sales channels | Physical stores, ulta.com, and mobile applications. | Ulta Form 10-K references retail stores, website, and mobile applications. |
| Inventory model | Multi-node network: regional DCs, market fulfillment centers, fast fulfillment center; store inventory also supports eCommerce fulfillment. | FY2025 Form 10-K: 4 regional DCs, 2 market fulfillment centers, 1 fast fulfillment center; ~500 stores in ship-from-store program. |
| Fulfillment options | BOPIS, curbside pickup, ship-from-store, ship-from-DC, same-day delivery. | Ulta filings and guest services documentation list supported fulfillment options. |
| Returns flow | Online purchases can be returned in-store; system-level return routing logic is not publicly disclosed. | Public return policy exists; architectural processing details not disclosed in filings. |
| Customer identity | Loyalty-based identity via Ulta Beauty Rewards ID across store and digital purchases. | Ulta documentation on Rewards ID usage and earning/redemption across channels. |
| Cross-partner identity linkage | Ulta Beauty Rewards can be linked to Target Circle for earning points on eligible purchases. | Target help documentation describing Ulta Rewards and Target Circle linkage. |
| Data latency | Real-time versus batch inventory visibility is not specified in public filings. | No latency disclosures in Form 10-K; third-party OMS materials reference real-time inventory (tech disclosure). |
| Key constraints | Distribution capacity risk, fulfillment complexity, and dependency on store nodes. | FY2025 Form 10-K risk disclosures on distribution and order fulfillment infrastructure. |
Channel & inventory connectivity
- Ulta operates a multi-tier distribution network: 4 regional DCs, 2 market fulfillment centers (support stores + eCommerce), and 1 fast fulfillment center (eCommerce only).
- Store inventory is an explicit fulfillment node: ~500 stores fulfill eCommerce orders through a ship-from-store program.
- Ulta’s disclosed fulfillment menu includes BOPIS, curbside, ship-from-store, ship-from-DC, and same-day delivery (capability list; not a performance claim).
Customer identity & data continuity
- Identity anchor is loyalty: Ulta Beauty Rewards is described as enabling points earning/redemption across purchases (including store and digital contexts).
- A persistent identifier is operationalized via Rewards ID, retrievable by email and printed on receipts (enables store ↔ account linkage at checkout).
- Partner linkage exists (Target): Target documentation states members can link Target Circle to earn Ulta Beauty Rewards points on applicable Ulta Beauty at Target purchases.
Order orchestration & fulfillment logic
- Filings confirm that Ulta supports multiple fulfillment paths, implying order sourcing can occur from stores or distribution nodes, but routing rules (store vs DC prioritization) are not publicly disclosed.
- Store pickup is positioned as a rapid fulfillment path (“pickup later that day”); however, system-level SLAs and routing logic are not disclosed.
- Tech disclosure (job/industry material): a publicly posted OMS deck claims inventory visibility and real-time inventory, promising; treat as indicative only, not a filing-backed statement.
Architectural trade-offs
- Speed vs complexity: Using ~500 store nodes for ship-from-store expands proximity fulfillment but increases orchestration complexity (inventory accuracy, exception handling), which Ulta implicitly acknowledges through its supply chain systems focus.
- Cost vs flexibility: A mixed network (regional DCs + market fulfillment centers + fast fulfillment center + store nodes) increases fixed infrastructure, but enables diversified fulfillment modes.
- Capacity as a constraint: Ulta discloses risk that distribution and order fulfillment infrastructure performance/capacity may be inadequate to support future growth, indicating an explicit dependency on this layer.
Analysis of Ulta Beauty’s growth marketing strategy
The Ulta Beauty marketing strategy is anchored in loyalty-led demand capture and hyper-personalization in retail, supported by a measurable spend discipline, app-driven engagement, and monetizable first-party audiences (USD, 2024–2025).
| Growth engine | Objective | Primary KPIs | Last 12M signal | Efficiency |
|---|---|---|---|---|
| Paid advertising (print, TV/radio, digital) | Acquire and retain demand at scale | Advertising expense (USD), ad % of net sales | USD 431.5m ad expense FY2025; +2.1% YoY | 3.8% of net sales (FY2025) |
| Loyalty program base | Retain and monetize customers | Active members, sales from members % | 44.6m members; >95% of sales (FY2025) | >95% sales contribution |
| Loyalty currency (points & gift cards) | Drive repeat and lock-in | Deferred revenue (USD) | Deferred revenue +15.0% YoY (FY2025) | Contract liabilities USD 492.9m |
| Mobile app | Increase frequency and digital monetization | App share of eCommerce, engagement growth | ~66% of eCommerce sales; +600 bps YoY (2024-Q3) | App = ~2/3 of digital sales |
| Retail media (UB Media) | Monetize first-party audience | Brand partners, investment growth % | 300 partners; +35% brand investment (2024-10) | Revenue not disclosed |
| Gift card breakage | Monetize stored value | Breakage revenue (USD) | USD 24.3m; +7.5% YoY (FY2024) | Non-operating revenue |
Paid advertising (print, TV/radio, digital)
- Advertising expense, net was USD 431.5m in FY 2025 vs USD 422.8m in FY 2024 (+2.1% YoY).
- Advertising expense remained 3.8% of net sales in FY 2025 and FY 2024.
- Ulta discloses a shift of a “growing percentage” of marketing expense toward digital, social, and streaming (no split disclosed).
Loyalty program base
- FY 2025 disclosure: 44.6m active loyalty members.
- FY 2025 disclosure: >95% of total sales came from loyalty members.
Loyalty currency liability (points + gift cards)
- Deferred revenue ending balance: USD 492.9m (FY 2025) vs USD 428.8m (FY 2024) (+USD 64.1m, +15.0%).
- Additions to contract liabilities: USD 362.6m (FY 2025) vs USD 332.4m (FY 2024) (+9.1%).
Mobile app as conversion surface
- App accounted for two-thirds of eCommerce sales in 2024-Q3.
- Earnings-call reporting: app share was up ~600 bps YoY in 2024-Q3.
- CX Dive reporting: app member engagement grew at a double-digit rate in 2024-Q3 (exact % not disclosed).
Retail media network (UB Media)
- Reported as of 2024-10-24: UB Media had 300 brand partners.
- Reported as of 2024-10-24: UB Media saw +35% annual increase in brand investment.
- Ulta frames UB Media as a driver of incremental vendor income (no revenue disclosed).
Credit card-linked loyalty
- Ulta discloses private-label and co-branded credit cards that are tied to maintaining the loyalty program (no penetration rate disclosed).
- FY 2023 disclosure notes “other revenue” leverage attributed in part to credit card income growth (no FY2025 standalone figure provided in this sentence).
Community and in-store events
- Ulta hosted more than 13,000 in-store events in 2024-Q3.
- Ulta Beauty Community “tripled” its initial user target by 2024-Q3 (no base or absolute users disclosed).
Analysis of the eCommerce strategy of Ulta Beauty
This section evaluates Ulta Beauty’s eCommerce strategy as a core component of the Ulta Beauty marketing strategy, through the lens of conversion clarity, cognitive load, and decision support across the full shopping journey. The analysis focuses on how homepage signaling, category navigation, product information structure, support decision-making, highlighting where AI shopping assistants outperform traditional chatbots, and checkout transparency shape digital performance, without duplicating revenue, marketing, or omnichannel execution insights covered elsewhere.
Home page analysis
What we liked
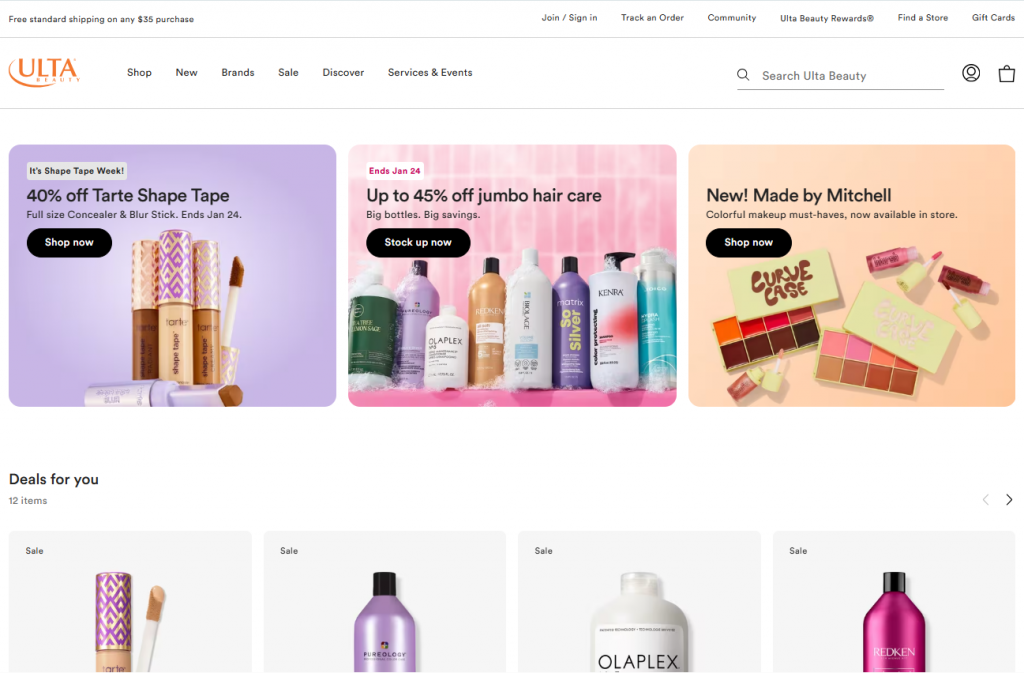
- Immediate value communication above the fold: the persistent utility bar highlights “Free standard shipping on any $35 purchase,” setting a clear price-to-convenience threshold before any scroll.
- Parallel intent coverage in the hero area: the three-tile hero row simultaneously promotes a brand discount (“40% off Tarte Shape Tape”), a category offer (“Up to 45% off jumbo hair care”), and a new brand launch (“Made by Mitchell”), supporting multiple entry intents at once.
- Trust and scale reinforced through product cards: recommendation sections like “We think you’ll like” surface ratings and volume (e.g., Dior Sauvage showing 4.7 stars with 4,530 reviews) directly on the home page.
What we didn’t like
- High cognitive load above the fold: the initial viewport combines utility messaging, full navigation, search, account/cart icons, and three promotional hero tiles, creating multiple competing attention anchors.
- The CTA hierarchy lacks prioritization: hero CTAs, such as “Shop now” and “Stock up now,” use identical visual weight across tiles, offering no clear primary action for first-time or undecided users.
- Carousel-heavy mid-page structure increases interaction cost: consecutive horizontal modules (“Deals for you,” “Today’s deals,” “We think you’ll like,” “New for you”) require repeated lateral scrolling, which is especially taxing on mobile devices.
Category page analysis
What we liked
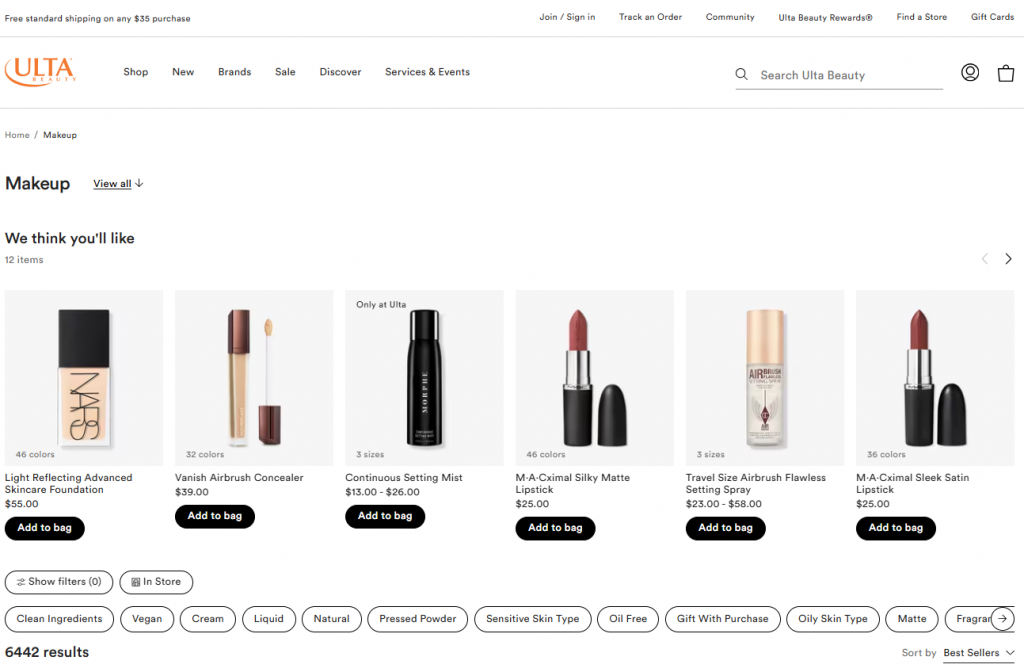
- Assortment scale is made explicit immediately: the Makeup category clearly states “6,442 results”, setting accurate expectations about depth before users engage with filters or scroll.
- High scan efficiency at product-card level: each card surfaces price, rating, review count, shade count (e.g., “46 colors”), and availability cues (“Only at Ulta,” “Sponsored”) without requiring PDP entry.
- Inline conversion is frictionless: the persistent “Add to bag” CTA on PLP cards enables direct purchase actions (e.g., Estée Lauder Double Wear Foundation at $52.00) without disrupting browsing flow.
What we didn’t like
- Filter discovery is visually deprioritized: filters are collapsed behind a “Show filters (0)” button while long chip rows (“Vegan,” “Oil Free,” “Matte,” “Sensitive Skin Type”) push filter interaction below the initial viewport.
- Horizontal filter chips increase cognitive load: the extended chip list requires lateral scanning and scrolling, especially when combined with a 6,442-SKU result set.
- Sponsored content blends tightly with organic results: sponsored products (e.g., NARS Radiant Creamy Concealer) appear inline with minimal differentiation, which can dilute perceived relevance within high-intent category browsing.
Product pages analysis
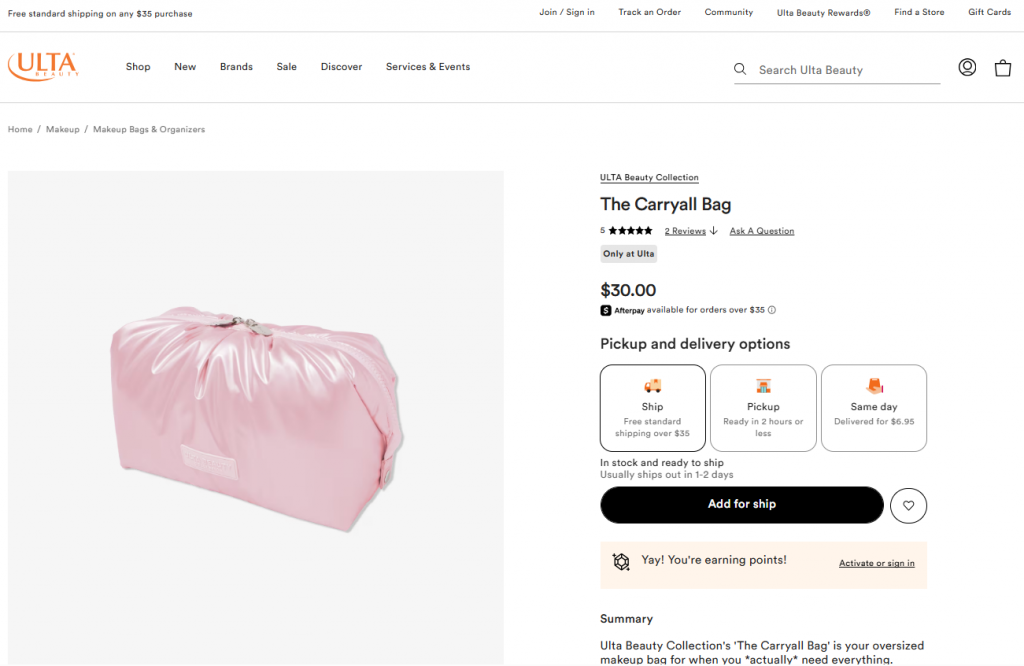
What we liked
- Critical purchase information is concentrated above the fold: price ($30.00), rating (5 stars with 2 reviews), exclusivity badge (“Only at Ulta”), and primary CTA (“Add for ship”) are all visible without scrolling.
- Fulfillment options are clearly differentiated and priced: the PDP presents three explicit paths (“Ship” with free shipping over $35, “Pickup” ready in 2 hours or less, and “Same day” delivery for $6.95), reducing delivery uncertainty at decision time.
- Bundled upsell is structured and transactional: the “Frequently bought together” module preselects complementary items (Carryall Bag + Anywhere Pouch + Vanity Bag) and surfaces a combined $81.00 subtotal with a single “Add 3 to Bag” CTA.
What we didn’t like
- Social proof depth is limited for decision reinforcement: the product shows only 2 reviews, which may be insufficient validation for undecided shoppers despite the 5-star rating.
- Primary CTA competes with secondary actions: the heart icon (wishlist) sits immediately next to the “Add for ship” button, introducing a parallel decision at the most conversion-critical moment.
- Product information hierarchy below the fold is fragmented: key details are split across expandable sections (“Summary,” “Details,” “Shipping & Coupon Restrictions”), requiring multiple interactions to build a complete understanding of the product.
Cart checkout flow
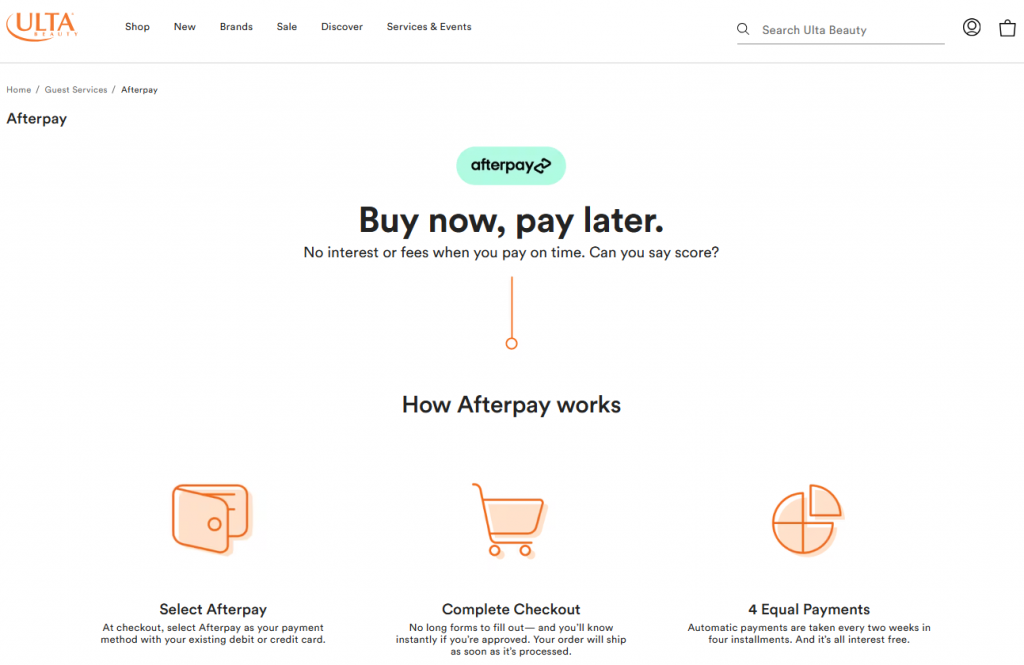
What we liked
- BNPL is documented by Ulta for web/app checkout: Afterpay is available, with extended repayment options for purchases over USD 400 (Guest Services, observed 2026-01).
What we didn’t
- Checkout step count, express pay mix, and guest checkout availability are Not disclosed with reproducible public evidence: the live checkout flow is not accessible from static public pages in a way that supports audited metrics (steps, form fields, payment rail coverage) for this draft.
- No dated Core Web Vitals breakdown by template (home vs PLP vs PDP vs checkout) is available from the sources captured here; only origin-level LCP distribution was captured.
Ulta Beauty’s marketing strategy resources: Best videos to watch
Michelle Crossan-Matos, CMO of Ulta Beauty: Visionary and Operator
Ulta Beauty’s UB Media Glows Up Retail Media With a Spark of Joy and Robust Data
Bizcast: Ulta Beauty’s Michelle Crossan-Matos on Brand Purpose, Strategy
Tech Innovators at CES 2026: Kelly Mahoney, CMO at Ulta Beauty
Ulta Beauty: The most impressive statistics of the cosmetic retailer
This set of statistics provides a concise, data-first snapshot of Ulta Beauty’s scale, efficiency, and strategic positioning within US beauty retail. Together, these figures contextualize the Ulta Beauty marketing strategy, highlighting the economic foundations that enable sustained growth, marketing stability, and operational leverage at a national scale.
Stat 1: Revenue scale
- Metric: USD 11.3B net sales
- Period: FY2024 (fiscal year ended 2025-02-01)
- Context: Confirms Ulta Beauty’s position as a scaled, national cosmetics retailer with sustained top-line relevance.
Stat 2: Operating margin
- Metric: 13.9% operating margin
- Period: FY2024
- Context: Signals strong profitability for a store-led beauty retailer, supporting reinvestment in growth, labor, and technology.
Stat 3: Store footprint
- Metric: 1,445 stores in the US
- Period: FY2024 year-end (2025-02-01)
- Context: Quantifies Ulta’s physical reach as a core competitive advantage in beauty retail.
Stat 4: Loyalty-driven revenue concentration
- Metric: 44.6M active Ulta Beauty Rewards members generating >95% of total sales
- Period: FY2024 disclosure
- Context: Demonstrates exceptional first-party data depth and repeat-purchase dependence at scale.
Stat 5: Gross margin
- Metric: 38.8% gross margin
- Period: FY2024
- Context: Highlights the economic headroom available to absorb promotions, logistics, and operating costs while maintaining profitability.
Latest news on Ulta Beauty
- Ulta set new long-term targets and accelerated its store expansion plan.
- CEO transition executed via succession planning.
- ERP and inventory modernization completed at enterprise scale.
- Ulta acquired Space NK (international expansion move).
- Q3 FY2025 results and guidance increase (financial signal).
- UB Marketplace launched on Ulta.com and the Ulta Beauty.
Lessons learned from Ulta Beauty’s marketing strategy
Ulta Beauty’s trajectory offers a set of structural lessons that extend beyond cosmetics or brand-specific execution. The Ulta Beauty marketing strategy illustrates how marketing effectiveness emerges when loyalty, physical scale, margins, and customer identity are deliberately aligned, and under what conditions other retailers can apply similar logic.
Loyalty becomes a growth engine only when it captures most revenue
- What Ulta Beauty did: Structured the business so that the vast majority of sales are tied to identifiable loyalty members rather than anonymous transactions.
- Why it worked: High loyalty penetration concentrated demand into a known customer base, improving measurement, retention leverage, and lifecycle control.
- When this applies: Works best when retailers have frequent purchase cycles and can incentivize account creation without heavy discounting.
Physical scale strengthens digital performance when stores are operational assets
- What Ulta Beauty did: Treated stores as active components of the demand and fulfillment system rather than standalone sales points.
- Why it worked: Store density reduced delivery friction and increased perceived convenience, reinforcing digital conversion rather than competing with it.
- When this applies: Applies when store networks reach sufficient density to support fast pickup or local fulfillment.
Margin headroom enables marketing stability through cycles
- What Ulta Beauty did: Operated with gross and operating margins that allowed continued investment during demand slowdowns.
- Why it worked: Margin buffer prevented reactive budget cuts that often erode long-term brand and customer equity.
- When this applies: Relevant for retailers with differentiated assortments or pricing power that can sustain mid- to high-teens operating margins.
A broad assortment requires disciplined navigation and signaling
- What Ulta Beauty did: Built scale around a very wide assortment while using category structure, filters, and trust signals to maintain shopability.
- Why it worked: Clear structure reduced the cognitive cost of choice in a high-SKU environment.
- When this applies: Applies when SKU counts exceed several thousand and discovery, not availability, becomes the main friction.
Growth maturity shifts the focus from acceleration to efficiency
- What Ulta Beauty did: Accepted slower comparable growth in later years while prioritizing profitability, loyalty depth, and capital discipline.
- Why it worked: Preserved long-term returns and organizational focus as expansion opportunities normalized.
- When this applies: Works when market penetration is already high and incremental growth becomes more expensive.
Marketing effectiveness improves when identity precedes activation
- What Ulta Beauty did: Anchored marketing, commerce, and engagement around a persistent customer identity rather than channel-specific interactions.
- Why it worked: Unified identity improved continuity across touchpoints and reduced fragmentation in customer understanding.
- When this applies: Applies when retailers can realistically link in-store and digital behavior to a single customer profile.
Key takeaways from Ulta Beauty’s marketing and retail strategy
Ulta Beauty’s performance reflects a consistent pattern: marketing effectiveness is the outcome of structural alignment, not isolated execution. The brand integrates scale, identity, and physical presence into a coherent system where demand creation, fulfillment, and customer recognition reinforce each other. Rather than optimizing channels independently, the Ulta Beauty marketing strategy works because it is embedded in the retail model itself, with marketing serving as an orchestrator of value rather than a standalone growth lever.
For retail leaders, the implication is clear. The next phase of competitive advantage will be defined by capabilities that connect data, channels, and decision-making speed across the organization. This shifts the focus from reach and messaging toward orchestration, identity continuity, and operational readiness across the customer lifecycle. As markets mature, integration and execution discipline matter more than acceleration alone.
Replicating this level of coordination is rarely straightforward. Many retailers reach a point where insight is plentiful, but execution becomes the constraint. This is often where platforms like ContactPigeon and agentic capabilities such as Menura AI come into the picture, supporting teams as they move from strategic intent to execution through AI agents for cosmetic retailers.