

Apple matters because it represents more than technology leadership. Apple’s marketing strategy shows how a retailer can turn product design, ecosystem control, brand trust, and direct customer relationships into a long-term competitive advantage. At a time when retail is shifting from transactional selling to connected customer ecosystems, Apple offers a clear example of how physical stores, digital channels, services, and product experience can work as one commercial model. This case matters for retail leaders because it highlights a structural shift in the industry: the strongest brands are no longer only selling products; they are building environments where customers stay, upgrade, subscribe, and return.
- Apple’s marketing strategy is built around a connected ecosystem, not isolated product promotion.
- Revenue scale remains product-led, with iPhone generating USD 209.6bn in FY2025 net sales.
- Services create a high-margin growth layer, reaching USD 109.2bn in FY2025 with a 75.4% gross margin.
- Apple balances control and reach, with direct channels accounting for 40% of FY2025 net sales and indirect channels for 60%.
- The strategic lesson for retailers is to connect brand, commerce, channels, data, and post-purchase value into one commercial system.
Performance timelines of Apple
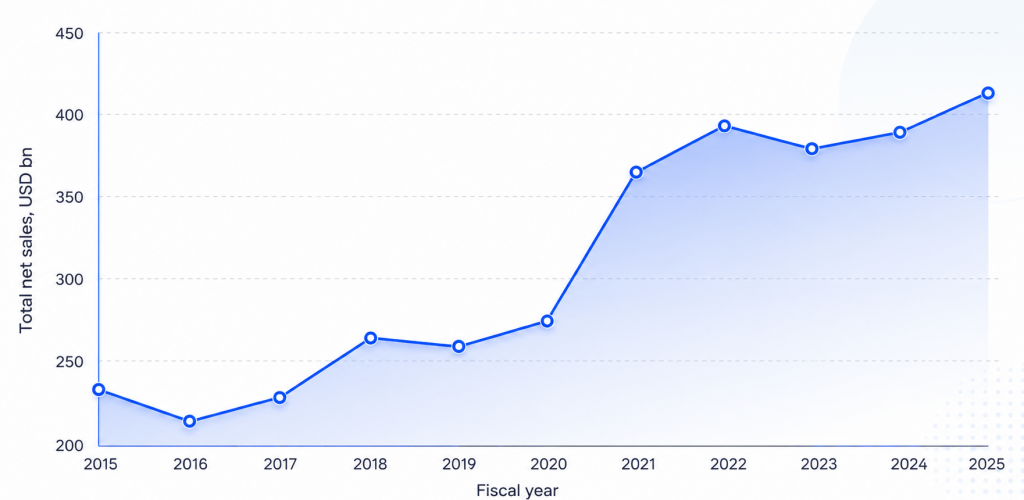
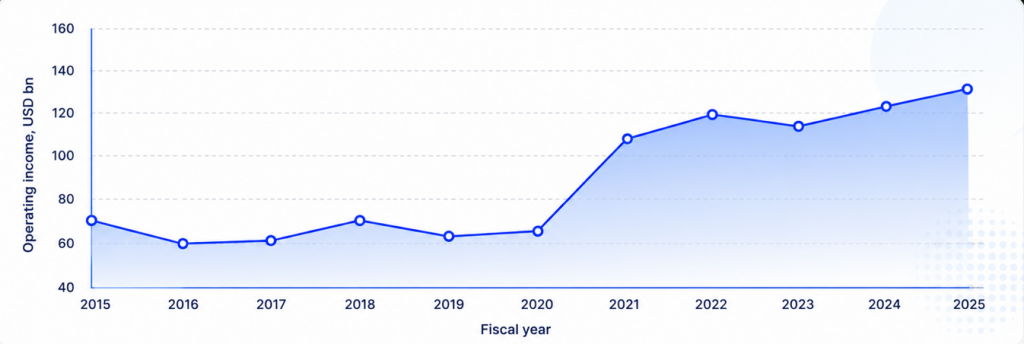
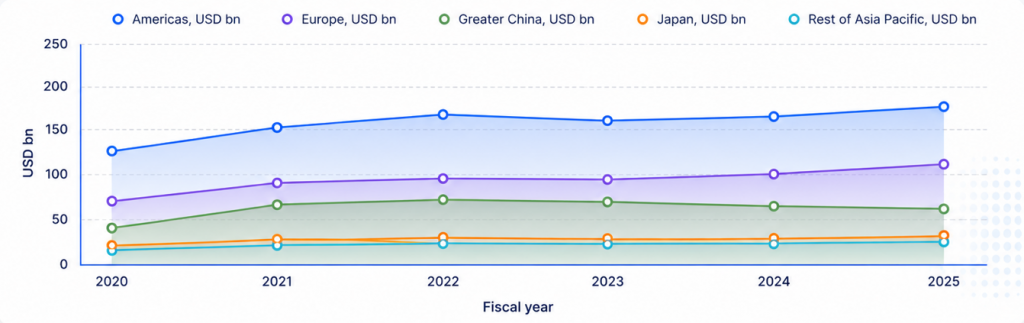
Apple’s performance timeline from FY2015 to FY2025 shows how the company expanded from a product-led technology retailer into a global ecosystem business. In the context of Apple’s marketing strategy, the available public data highlights three executive-level dimensions of performance: total revenue scale, operating income growth, and regional revenue distribution.
Net sales of Apple (2015-2025)
Operating income of Apple (2015-2025)
Geographical income of Apple (2020-2025)
Business model decoded: Apple’s retail strategy explained
Apple’s business model combines premium hardware sales, a growing Services layer, and direct and indirect distribution across global markets. The primary economic lever behind Apple’s marketing strategy is ecosystem scale: hardware creates the installed base, while Services increase recurring revenue and margin contribution.
| Dimension | Apple Reality | Evidence / Source |
|---|---|---|
| Core value proposition | Integrated hardware, software, services, security, product quality, design, and ecosystem access. | Apple FY2025 Form 10-K, Business and Competition sections |
| Assortment model | Apple sells its own product families, including iPhone, Mac, iPad, Wearables, Home and Accessories, and Services. It also resells selected third-party products through direct channels. | Apple FY2025 Form 10-K, Business section |
| Primary revenue streams | Product revenue remains the largest stream. In FY2025, iPhone generated USD 209.6bn, Services USD 109.2bn, Mac USD 33.7bn, iPad USD 28.0bn, and Wearables, Home and Accessories USD 35.7bn. | Apple FY2025 Form 10-K, Products and Services Performance |
| Channel mix | Apple sells through retail stores, online stores, direct sales, carriers, and resellers. In FY2025, direct channels accounted for 40% of net sales and indirect channels for 60%. | Apple FY2025 Form 10-K, Markets and Distribution |
| Margin profile | FY2025 total gross margin was 46.9%. Product gross margin was 36.8%, while Services gross margin was 75.4%. | Apple FY2025 Form 10-K, Gross Margin |
| Cost intensity | Major cost drivers include components, outsourced manufacturing, logistics, R&D, SG&A, tariffs, foreign exchange, and content costs for services. | Apple FY2025 Form 10-K, Risk Factors and Operating Expenses |
| Key constraints | Apple depends on outsourcing partners, single-source or limited-source components, indirect distribution partners, and third-party software developers. | Apple FY2025 Form 10-K, Risk Factors |
Value creation logic
- Integrated ecosystem: Apple designs and develops nearly the entire solution for its products, including hardware, operating systems, software applications, and related services.
- Assortment concentration: iPhone remains the core revenue product, representing USD 209.6bn of Apple’s USD 416.2bn FY2025 net sales.
- Services attachment: Services generated USD 109.2bn in FY2025 and include advertising, AppleCare, cloud services, digital content, payment services, and subscriptions.
Value capture & economics
- Margin mix: Apple’s FY2025 Services gross margin was 75.4%, compared with 36.8% for Products.
- Profitability signal: FY2025 operating income was USD 133.1bn on USD 416.2bn of net sales, equal to an operating margin of about 32.0%.
- Cost drivers: Gross margins are exposed to component costs, outside manufacturing services, content costs, tariffs, foreign exchange, warranty costs, and product mix.
Scale effects & structural advantages
- Distribution scale: Apple combines owned retail and online stores with indirect distribution through carriers and resellers. Direct channels accounted for 40% of FY2025 net sales, while indirect channels accounted for 60%.
- Manufacturing scale: A significant majority of Apple’s manufacturing is performed by outsourcing partners located primarily in the Chinese mainland, India, Japan, South Korea, Taiwan, and Vietnam.
- Operating leverage: Operating expenses represented 15% of net sales in FY2025, while total gross margin reached 46.9%.
Structural limits & trade-offs
- Supply concentration: Apple relies on single-source partners in the U.S., Asia, and Europe for many components and on partners primarily located in Asia for final assembly of substantially all hardware products.
- Purchase commitment exposure: Apple had USD 56.2bn in manufacturing purchase obligations as of September 27, 2025, with USD 55.4bn payable within 12 months.
- Channel dependency: Apple depends on carriers and other resellers, many of which also distribute competing products.
Omnichannel architecture: Apple’s online-to-offline retail strategy
Apple’s omnichannel model connects owned retail stores, Apple Store Online, the Apple Store app, and indirect distribution into a multi-channel commercial system. As part of Apple’s marketing strategy, direct channels support customer control, while indirect channels extend reach; hybrid fulfillment is publicly evidenced through online delivery, in-store pickup, and Apple-managed returns.
| Layer | Apple Implementation | Evidence / Source |
|---|---|---|
| Sales channels | Apple sells through retail stores, online stores, direct sales, carriers, wholesalers, retailers, and resellers. | Apple FY2025 Form 10-K, Markets and Distribution |
| Mobile app layer | The Apple Store app supports product browsing, order tracking, account management, stored payments, shipping address management, self-checkout for accessories, and store location features. | Apple Store app listing, App Store |
| Inventory model | Store-level and order-level inventory architecture is not publicly disclosed. Apple publicly discloses delivery for in-stock products and in-store pickup for online purchases. | Apple Delivery and Pickup page |
| Fulfillment options | Apple supports delivery, two-hour courier delivery for eligible in-stock products in most metros, in-store pickup, and store or online-started returns. | Apple Delivery and Pickup page; Apple Returns & Refunds |
| Customer identity | Apple Account is the account used for Apple services. Apple Store app data can include Apple account, shopping activity, subscriptions, purchases, identifiers, payment info, and location. | Apple Account page; Apple Store app listing |
| Data latency | Not publicly disclosed. Apple does not publicly state whether retail stock, order, or customer profile data operates in real time or batch mode. | Not publicly disclosed |
| Key constraints | Apple manages regions separately and uses both direct and indirect channels. Apple also depends on carriers and resellers, many of which sell competing products. | Apple FY2025 Form 10-K, Markets and Distribution and Risk Factors |
Channel & inventory connectivity
- Channel stack: Apple’s direct channel includes retail stores, online stores, and direct sales, while indirect distribution includes third-party cellular network carriers and other resellers.
- Hybrid fulfillment: Apple publicly supports online ordering with free delivery, in-store pickup, two-hour courier delivery for eligible in-stock products in most metros, and pickup-status tracking.
- Disclosure limit: Apple does not publicly disclose whether inventory is centralized, store-node based, regionally allocated, or updated in real time.
Customer identity & data continuity
- Identity layer: Apple Account functions as the account used for Apple services and is used to sign in for order viewing and editing.
- Order continuity: Apple’s online order tools allow customers to check status, track shipments, return or cancel eligible items, edit delivery or billing information, view pickup information, and print invoices.
- Data linkage: The Apple Store app listing states that data linked to the user may include purchase history, payment information, identifiers, location, contact information, search history, usage data, and diagnostics.
- Disclosure limit: Apple does not publicly disclose a single unified retail customer ID across POS, app, online store, support, and reseller channels.
Order orchestration & fulfillment logic
- Order status logic: Apple publicly displays order states such as processing, preparing to ship, shipped, delivered, shipping to store, check in today, ready for pickup, and picked up.
- Pickup flow: Apple supports in-store pickup for online purchases and sends emails and notifications through the pickup process.
- Returns flow: Direct purchases from Apple, either online or at an Apple Retail Store, can be returned to Apple within 14 calendar days, while products bought through other retailers follow the retailer’s own policy.
- Disclosure limit: Apple does not publicly disclose order routing rules, store-versus-warehouse prioritization, allocation logic, or fulfillment capacity thresholds.
Architectural trade-offs
- Control vs reach: Direct channels give Apple more control over the customer account, payment, service, pickup, and returns experience; indirect channels extend distribution through carriers and resellers.
- Flexibility vs complexity: Apple’s online-to-store capabilities require coordination across store pickup, shipping-to-store status, delivery, courier delivery, and returns, but the underlying orchestration architecture is not publicly disclosed.
- Regional structure: Apple manages reportable segments separately to align with local customers, distribution partners, and market dynamics, which indicates regional operating complexity.
- Partner dependency: Apple’s indirect channels include carriers and other resellers, many of which also sell competing products.
Analysis of Apple’s growth marketing strategy
Apple’s growth marketing strategy is best understood through the signals the company does disclose: product-category demand, Services expansion, App Store ecosystem scale, channel mix, and regional revenue movement. Because Apple does not publicly report CAC, ROAS, paid media spend, CRM performance, or campaign incrementality, this section focuses only on verifiable growth indicators.
| Growth engine | Objective | Primary KPIs | Last 12M signal | Owner |
|---|---|---|---|---|
| Product-led demand generation | Drive demand across core device categories. | Product net sales by category. | iPhone +4% YoY; Mac +12% YoY; iPad +5% YoY, FY2025. | Product marketing / retail / regional sales |
| Services monetization | Increase recurring and platform-linked revenue. | Services net sales; Services gross margin. | Services +14% YoY to USD 109.2bn; Services gross margin 75.4%, FY2025. | Services / App Store / subscriptions |
| App Store ecosystem growth | Expand platform-side commerce and developer ecosystem activity. | Developer billings and sales. | App Store ecosystem facilitated USD 1.4tn in developer billings and sales in 2025, up from USD 1.3tn in 2024. | App Store / developer relations |
| Apple advertising platforms | Monetize owned demand surfaces within Apple’s Services segment. | Advertising contribution to Services growth. | Apple stated that FY2025 Services growth was driven partly by advertising. | Apple Ads / Services |
| Direct and indirect distribution | Convert demand across owned and partner channels. | Direct vs indirect net sales mix. | Direct channels accounted for 40% of FY2025 net sales; indirect channels accounted for 60%. | Retail / online store / channel sales |
| Regional demand activation | Support demand across Apple’s major geographic segments. | Regional net sales growth. | Japan +15% YoY; Europe +10% YoY; Americas +7% YoY; Rest of Asia Pacific +10% YoY; Greater China -4% YoY, FY2025. | Regional marketing / country teams |
Product-led demand generation
- iPhone net sales increased 4% YoY to USD 209.6bn in FY2025.
- Mac net sales increased 12% YoY to USD 33.7bn in FY2025.
- iPad net sales increased 5% YoY to USD 28.0bn in FY2025.
- Apple does not disclose paid media spend, campaign ROAS, CAC, or launch-level incrementality.
Services monetization
- Services net sales increased 14% YoY to USD 109.2bn in FY2025.
- Apple states that Services growth was driven primarily by advertising, the App Store, and cloud services.
- Services gross margin reached 75.4% in FY2025, compared with 73.9% in FY2024.
- Apple does not disclose subscriber acquisition cost, churn, CRM revenue, or retention campaign performance.
App Store ecosystem growth
- Apple reported that the App Store ecosystem facilitated USD 1.4tn in developer billings and sales in 2025.
- This increased from USD 1.3tn in 2024.
- Apple states that more than 90% of App Store ecosystem billings and sales were commission-free to Apple in 2025.
- This supports platform reach, but it is not equivalent to Apple’s revenue.
Apple advertising platforms
- Apple lists advertising as part of Services, including third-party licensing arrangements and Apple’s own advertising platforms.
- Apple states that FY2025 Services growth was driven partly by higher advertising revenue.
- Apple does not separately disclose Apple Ads revenue, paid search share, ROAS, advertiser count, or ad product margin.
- External estimates exist, but they are not official Apple disclosures.
Direct and indirect distribution
- Apple’s direct channels accounted for 40% of total net sales in FY2025.
- Apple’s indirect channels accounted for 60% of total net sales in FY2025.
- Direct channels include Apple retail stores, online stores, and direct sales.
- Indirect channels include carriers, wholesalers, retailers, and resellers.
Regional demand activation
- Americas net sales increased 7% YoY to USD 178.4bn in FY2025.
- Europe net sales increased 10% YoY to USD 111.0bn in FY2025.
- Japan net sales increased 15% YoY to USD 28.7bn in FY2025.
- Greater China net sales decreased 4% YoY to USD 64.4bn in FY2025.
Analysis of the eCommerce strategy of Apple
Apple’s eCommerce strategy is built around reducing decision complexity in high-consideration purchases. Within Apple’s marketing strategy, the homepage, category pages, product pages, and checkout all support guided comparison, transparent configuration, financing visibility, and low-friction purchase completion.
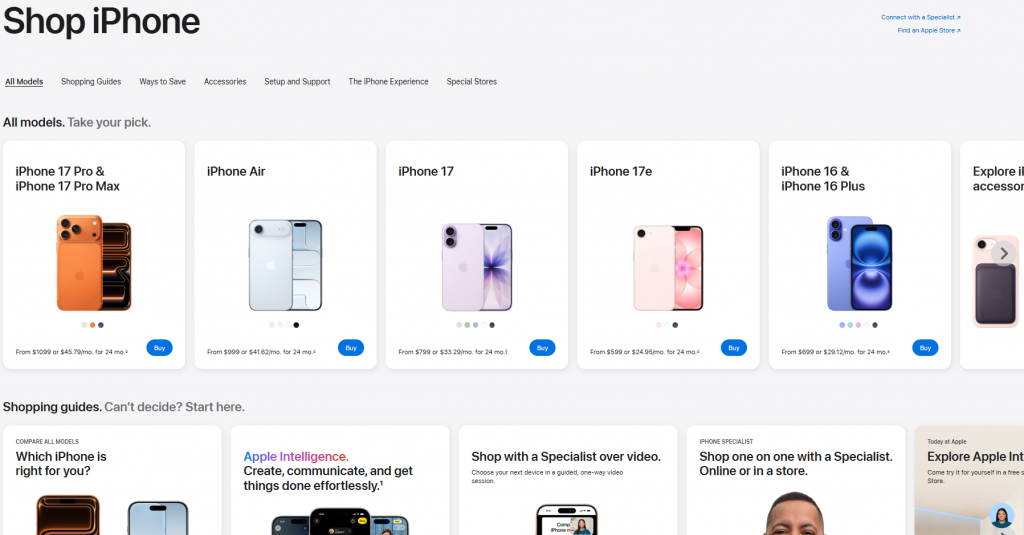
Home page analysis

What we liked
- The homepage exposes 10 primary navigation categories, including Store, Mac, iPad, iPhone, Watch, Vision, AirPods, TV & Home, Entertainment, and Accessories.
- The homepage links the hero iPhone module to 2 intent paths, “Learn more” and “Shop iPhone,”.
- Seasonal merchandising is active with a Father’s Day, June 21, gift module.
What we didn’t
- The homepage includes a large entertainment carousel with 9 listed items, but engagement data is not disclosed.
- The homepage gives several major product stories similar visual weight, which can make the next step less obvious for shoppers who arrive without a specific product in mind.
Category pages analysis (PLP)
What we liked
- The category page gives shoppers several comparison paths, savings messages, and product options, which can feel dense for someone still trying to understand the differences between models.
- The page is helpful for guided discovery, but the amount of information may slow down shoppers who already know which product they want.
- Savings options are useful, but the mix of trade-in, carrier deals, Apple Card installments, refurbished products, and upgrade programs can make the buying path feel less straightforward.
What we didn’t
- Apple does not publicly disclose how shoppers use comparison tools, savings options, or model-selection paths.
- The category page supports product discovery well, but its performance impact cannot be measured without access to internal click and conversion data.
- Search visibility elements, such as structured data, would need a separate SEO audit before drawing conclusions.
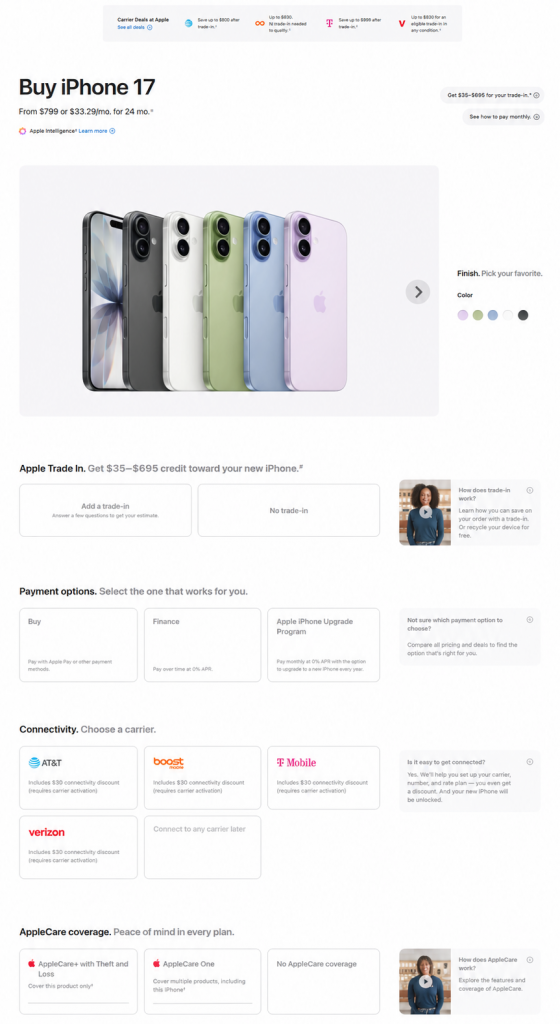
Product pages analysis (PDP)
What we liked
- The PDP supports 5 activation paths: connect later, AT&T, Boost Mobile, T-Mobile, and Verizon.
- The PDP shows 2 storage options and 5 visible colors for iPhone 17.
- The PDP includes high-value affordability messaging, including up to USD 999 with T-Mobile trade-in and up to USD 830 with Boost Mobile or Verizon.
What we didn’t
- The product page gives shoppers many choices at once, including carrier, color, storage, trade-in, and payment options, which can feel heavy for less decisive buyers.
- The configuration flow is detailed, but shoppers who simply want a fast purchase may need to move through more steps than expected.
- Savings messages are useful, but the number of trade-in, carrier, and financing options can make the final price feel less immediate.
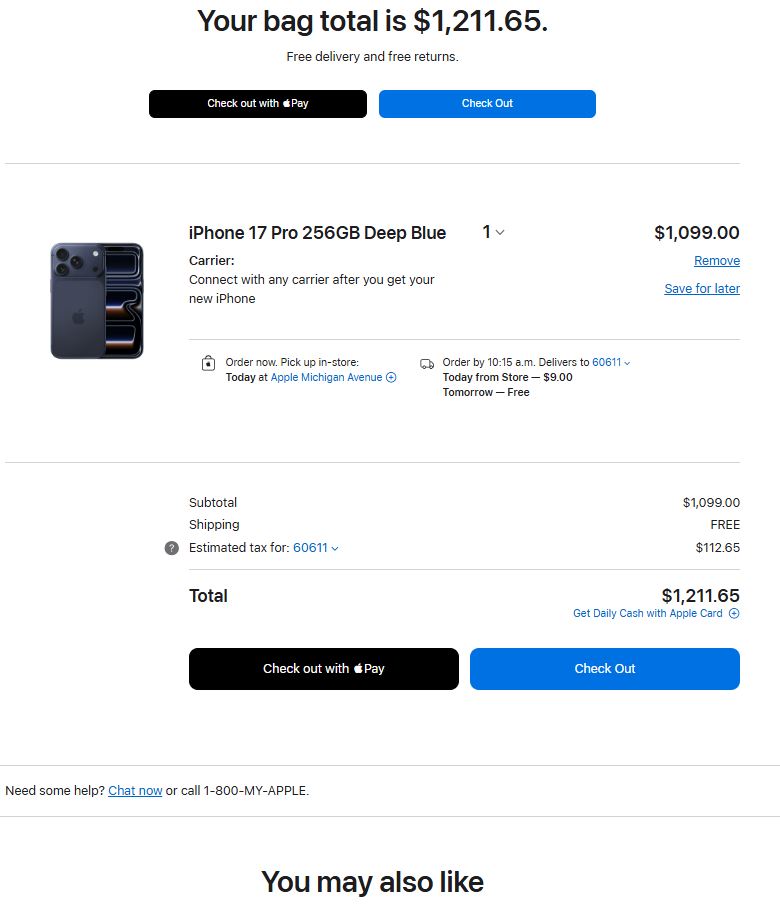
Cart checkout flow analysis
What we liked
- Apple supports Guest Checkout, allowing customers to purchase without an Apple Account or password.
- Guest checkout requires customers to add items to the bag, enter shipping information, enter payment information, and place the order.
- Apple states that shipping costs are displayed on the checkout page before order completion.
- Apple Pay can be used on the web, in apps, and in stores.
What we didn’t
- Checkout remains functional, but the number of delivery, pickup, payment, and financing choices can make the final decision feel heavier than expected.
- Some shipment timing details depend on the selected payment method, which may create uncertainty for shoppers who want a clear delivery date upfront.
- The checkout experience is clean, but it still requires shoppers to move through several practical decisions before completing the order.
Apple’s marketing strategy resources: Best videos to watch
Tim Cook Discusses The Past, Present, and Future of Apple | WIRED
Apple Execs on What Went Wrong With Siri, iOS 26 and More (Full Interview) | WSJ
The Talk Show: Live From WWDC 2024
Why Angela Ahrendts wants Gen Z to say, “Meet me at Apple”
Apple: The most impressive statistics of the technology retailer
Apple’s numbers show the scale of a technology retailer built on hardware demand, Services profitability, and global channel reach. For retail leaders, these statistics offer a clear view of how Apple’s marketing strategy is supported by revenue scale, margin protection, and an ecosystem that extends beyond the initial product sale.
1: Revenue scale
- Metric: USD 416.2bn total net sales
- Period: FY2025
- Context: Shows Apple’s global commercial scale across products, services, and regions.
2: Operating profitability
- Metric: USD 133.1bn operating income
- Period: FY2025
- Context: Indicates Apple’s ability to convert global revenue into operating profit.
3: Gross margin profile
- Metric: 46.9% total gross margin
- Period: FY2025
- Context: Shows the margin profile behind Apple’s combined products and services model.
4: Services margin
- Metric: 75.4% Services gross margin
- Period: FY2025
- Context: Highlights the profitability of Apple’s Services layer compared with hardware.
5: iPhone revenue base
- Metric: USD 209.6bn iPhone net sales
- Period: FY2025
- Context: Confirms iPhone as Apple’s largest disclosed product revenue category.
6: Services growth
- Metric: USD 109.2bn Services net sales, +14% YoY
- Period: FY2025
- Context: Shows the scale and growth of Apple’s recurring and platform-linked revenue stream.
7: Channel mix
- Metric: 40% direct channel sales and 60% indirect channel sales
- Period: FY2025
- Context: Shows how Apple balances its owned retail and online channels with those of carriers, wholesalers, retailers, and resellers.
8: App Store ecosystem scale
- Metric: Over USD 1.4tn in developer billings and sales
- Period: 2025
- Context: Shows the commercial scale of Apple’s broader platform ecosystem, although this is not equivalent to Apple’s revenue.
Latest news on Apple
- WWDC26: Apple unveils next generation of Apple Intelligence, Siri AI, powerful parental controls, and an expansive set of software improvements
- Due to DMA, Siri AI delayed in EU for iOS 27 and iPadOS 27
- European Commission fines Apple EUR 500mn under the DMA
- Apple raises its U.S. investment commitment to USD 600bn
- Apple reports second quarter results
- Apple’s China smartphone sales rebound in early 2026
Replicate the Commercial System Behind Apple’s Ecosystem-Led Growth
Apple connects product demand, Services revenue, direct customer access, and channel reach into one commercial system. Select a pillar to see how similar capabilities are operationalized with ContactPigeon.
Lessons learned from Apple's marketing strategy
Apple’s case shows that retail marketing performs best when it is connected to the full commercial system, not treated as a separate layer of communication. The lessons below translate Apple’s approach into practical principles for retailers who want to strengthen demand, margins, customer retention, and long-term growth.
Build demand around a clear commercial system, not isolated campaigns
- What Apple did: Apple connected product demand, Services growth, owned channels, and partner distribution into one commercial model.
- Why it worked: Each layer reinforced the next, with hardware creating the installed base and Services expanding value after purchase.
- When this applies: Works best when a retailer has repeat purchase potential, attachable services, subscriptions, warranties, or product ecosystems.
Use channel control where it improves margin and customer continuity
- What Apple did: Apple balanced direct channels, which accounted for 40% of FY2025 net sales, with indirect channels, which accounted for 60%.
- Why it worked: Direct channels supported tighter control over the buying relationship, while indirect channels expanded market access.
- When this applies: Works when a brand needs both owned customer data and broad third-party distribution to reach scale.
Treat services as a margin layer, not only an add-on
- What Apple did: Apple grew Services to USD 109.2bn in FY2025, with a Services gross margin of 75.4%.
- Why it worked: Services created a higher-margin revenue layer around an existing product base.
- When this applies: Works when a retailer can attach memberships, care plans, subscriptions, financing, content, or support to core products.
Reduce buying complexity before optimizing conversion
- What Apple did: Apple’s eCommerce experience structures product discovery around comparison, configuration, financing visibility, and checkout clarity.
- Why it worked: High-consideration purchases require confidence before speed; simplification supports movement from evaluation to purchase.
- When this applies: Works when products have multiple versions, price points, financing options, compatibility needs, or long replacement cycles.
Scale requires regional flexibility, not one global playbook
- What Apple did: Apple reports performance across the Americas, Europe, Greater China, Japan, and the Rest of Asia Pacific, with different growth patterns by region.
- Why it worked: The model allowed Apple to operate globally while adapting to regional demand, regulation, distribution partners, and market maturity.
- When this applies: Works when retailers operate across markets with different consumer behaviors, regulatory rules, and channel structures.
Protect the platform that creates the customer relationship
- What Apple did: Apple invested in owned operating systems, devices, App Store infrastructure, retail channels, and account-based customer access.
- Why it worked: Control over the platform reduced dependency on external demand sources and strengthened post-purchase monetization.
- When this applies: Works when retailers can build durable customer accounts, logged-in experiences, owned apps, loyalty layers, or proprietary services.
Growth strategy must account for structural constraints early
- What Apple did: Apple’s model depends on suppliers, manufacturing partners, carriers, resellers, developers, and regulatory conditions in major markets.
- Why it worked: The company scaled by combining control in strategic areas with partner leverage where full ownership would limit reach.
- When this applies: Works when retailers are scaling through complex supply chains, marketplaces, franchise networks, wholesale partners, or regulated categories.
What makes Apple’s marketing strategy different from traditional retail marketing?
Apple’s marketing strategy is connected to its full commercial system. Product design, Services, owned retail, digital channels, and customer accounts work together to support repeat engagement beyond the first purchase.
Why is Apple’s Services business important to its retail strategy?
Services add a recurring and higher-margin layer to Apple’s hardware base. In FY2025, Services generated USD 109.2bn in net sales and reached a 75.4% gross margin.
How does Apple balance direct and indirect channels?
Apple uses direct channels for customer control and indirect channels for market reach. In FY2025, direct channels accounted for 40% of net sales, while indirect channels accounted for 60%.
What can retail leaders learn from Apple’s eCommerce strategy?
The main lesson is to reduce buying complexity before optimizing conversion. Apple’s online experience supports comparison, configuration, financing visibility, and checkout clarity for high-consideration purchases.
Is Apple’s model easy for other retailers to copy?
No. The transferable lesson is not to copy Apple’s tactics, but to connect demand generation, margin structure, customer continuity, and channel strategy into one operating model.
Key takeaways from Apple’s marketing and retail strategy
Apple’s performance reflects a clear strategic pattern: marketing effectiveness is strongest when it is built into the commercial system, not added on top of it. The brand connects product demand, Services monetization, owned channels, partner distribution, and customer continuity into a model where each layer reinforces the next. Rather than treating marketing as a separate growth function, Apple’s marketing strategy shows how brand, commerce, product experience, and post-purchase value can work together to protect both revenue and margin.
For retail leaders, the lesson is not to copy Apple’s ecosystem. It is to understand the operating logic behind it. The next phase of retail growth will depend on how well brands connect customer data, channel execution, lifecycle engagement, and decision-making speed across the business. As competition intensifies, the advantage will shift from simply reaching more customers to recognizing them better, guiding them more effectively, and keeping them engaged after the first purchase.
Reaching that level of coordination is difficult when teams, tools, and customer signals remain disconnected. This is where platforms like ContactPigeon and agentic capabilities such as Menura AI become relevant. Together, they help retailers move from strategy to execution by connecting customer intelligence, omnichannel orchestration, and AI-guided decision-making into one operating layer.