

In the digital marketing age, a Chief Marketing Officer (CMO) juggles multiple tasks, tracking many marketing channels and outreach efforts. A CMO dashboard is valuable for monitoring dozens of campaigns across platforms and other crucial marketing activities. A robust dashboard gives CMOs all the data they need to determine which marketing channels are working and which may need attention. They don’t have to sift through multiple reports and piles of information to make marketing decisions, and they can create performance-based marketing strategies faster than ever.
Table of Contents
- > FAQ to get an in-depth understanding of a CMO dashboard
- > Fabricating an exquisite CMO dashboard
- > Key elements of a 360-degree CMO dashboard
- > Critical KPIs & metrics a CMO dashboard should not miss
- > CMO dashboard examples for retailers to follow
- > Finest tools for faultless and fruitful eCommerce reporting
- > Without data, you’re just another person with an opinion
FAQ to get an in-depth understanding of a CMO dashboard
Unfamiliar with the CMO dashboard? Check out this overview to get up to speed.
What is a CMO dashboard?
A CMO dashboard is a tool marketing executives use to measure how their efforts are paying off. The dashboard includes key performance indicators (KPIs) for various marketing campaigns and channels in one place for easy access and quick decision-making.
Why are CMO dashboards essential for eCommerce and retail businesses?
To reach more potential customers and generate sales, eCommerce business owners must use combinations of different strategies. Omnichannel marketing is one of the most effective ones, and, of course, the results of each campaign should be monitored closely and evaluated frequently. A CMO marketing dashboard offers a glance at each channel, saving marketing officers the time they would spend digging through multiple reports. They get valuable information that helps them prioritize marketing efforts and ad spending.
What components should a CMO dashboard have?
CMO dashboard components vary based on marketing objectives, but they should include the following information:
- Revenue per channel
- Lifetime value
- New sessions per page
- Conversion rate
- Bounce rate
- SEO metrics
- Reputation
- Social media metrics
- Campaign spend
- Ad impressions
Is it obligatory for all businesses to have a CMO dashboard?
If a business only works with a limited number of marketing channels, it might not need a CMO dashboard. Small business owners might not use a CMO dashboard because they don’t have to justify the return on marketing investment to the rest executive team. However, these dashboards enhance decision-making and help marketing teams and business owners focus on their most successful marketing channels.
Fabricating an exquisite CMO dashboard
Creating the best CMO dashboard for any business may be challenging, so below, you’ll find these tips to structure the ideal format for your needs.
Key elements of a 360-degree CMO dashboard
A 360-degree CMO dashboard offers the complete picture of marketing efforts and how they impact a business. The best CMO dashboards give readers a glance at the most important information, painting a picture of marketing successes and ROI. These elements will get a business there.

Visual metrics and KPIs
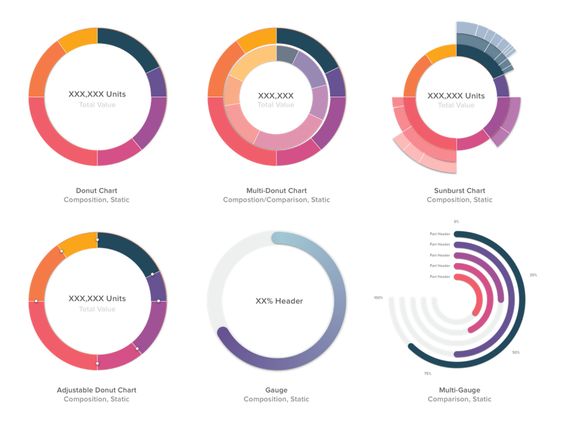
A CMO marketing dashboard appeals to executives because it distills critical information into a format that’s easy to read. Instead of reading long reports full of text, they can see graphs, charts, and solid numbers. A good CMO dashboard should read like an infographic including the most important information displayed in a visually appealing and simple way.
An overview of all campaigns
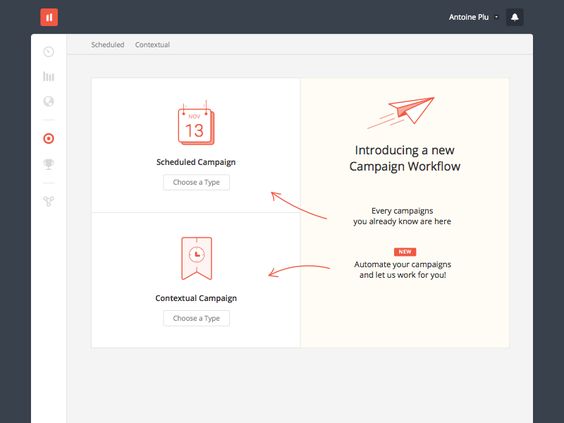
Since a CMO dashboard allows executives to quickly compare campaigns, it should offer a side-by-side comparison of marketing campaigns, allowing the team to track each channel’s effectiveness. Break each campaign into total cost and cost-per-lead to see how each campaign pays off.
Flexibility
CMO dashboard templates should allow the marketing team to add metrics as needed. If they pick up new channels, they should be able to easily add them to the template. A good template will also be compatible with large sets of data.
Easily integrated with multiple platforms
When choosing a CMO dashboard, look for one with multiple integrations. Connecting the dashboard with social media accounts, ad management tools, Google and other analytics tools, and Ahrefs or other SEO platforms helps eliminate the need to input information manually. CMOs should start with a list of the platforms and data they use most often and find templates that integrate with them.
Contain relevant data
A well-designed CMO dashboard means nothing if it lacks the correct data. Before building the dashboard, the marketing team should identify their most important metrics so they can track the KPIs that matter most.
Critical KPIs & metrics a CMO dashboard should not miss
The most critical metrics will fall into the following categories:
- Revenue
- Marketing
- Supply Chain
Of all metrics, revenue per channel is one of the most critical. This statistic offers insights into how each channel is working. eCommerce conversion rate is another key metric to evaluate how successfully marketing channels inspire people to purchase items. Consider adding these metrics to a CMO dashboard to round out essential KPIs.
Revenue KPIs & metrics
Revenue metrics offer a glimpse of each marketing effort’s impact on the retail business as a whole.
- Revenue: Total revenue is a critical metric, particularly for goal setting. All marketing efforts are created to increase revenue, and this metric sets a benchmark for measuring how it increases with marketing.
- Revenue per channel: To see which marketing channels are most successful, the marketing team should track their contribution to company revenue.
- Lifetime value: This metric shows a business owner whether their marketing efforts are paying off. If the average cost to convert a customer is $150, but their lifetime value is only $75, the marketing team may need to work on improving customer loyalty.
- eCommerce conversion rate (eCR): This metric refers to how many people make a purchase from a retailer’s website compared to the total number of visitors. It is important because it helps the marketing team see which parts of the website might need stronger CTAs and other tools to motivate people to buy.
- Profit margin: Highlighting the profit margin gives the marketing team an idea of which products to feature in ads to drive sales.
- Average order value (AOV): By tracking this metric, the marketing team can develop marketing strategies to encourage customers to buy more during each site visit.
- Customer acquisition cost (CaC): Like lifetime value, this is an essential metric that helps the marketing team determine how well their efforts are working. This number should be lower than the lifetime value.
- Return on ad spend (RoaS): Track this metric to focus marketing efforts on those with the highest return.
Marketing KPIs & metrics
These KPIs offer deeper insight into various marketing campaigns.
a. On-site behavioral metrics
- Total sessions: Track this metric to determine how many people are logging into a retail site every month.
- Total users (Unique): With this metric, the marketing team can differentiate between people who keep coming back to the site and who are new.
- Percentage of new users: Use this statistic to measure a campaign’s success at driving new users to the website.
- Bounce rate: With this metric, the marketing team can see which parts of a website may need to be refined to improve engagement.
- Average session duration: A business owner can gauge whether their website is engaging and easy to use by tracking this metric. Longer sessions mean users are likely to consume more content.
- Pages per session: If this number is low, it could mean the site is hard to navigate or the CTAs could be more assertive.
b. PPC/Paid Ads Metrics
- Total impressions: Tracking impressions are vital to calculating other metrics like click-through rates accurately.
- Average click-through rate (CTR): Use this metric to measure how successfully a marketing campaign worked.
- Total clicks to the website: This metric highlights how many people clicked on the website with each ad campaign.
- Total conversions: Another way to measure ad campaign success, this metric highlights how many people made a purchase after clicking on the website.
- Cost per conversion: With this metric, the marketing team gets a deeper insight into their campaign ROI, because they can see how much they had to spend to get a conversion and compare it to the average sale.
- Return on ad spend (RoaS): Comparing the return on ad spend for each campaign offers insight into which channels are most successful, allowing the marketing team to analyze their strategy.
c. Search Engine Optimization (SEO) Metrics
- Total organic clicks: Measuring organic clicks versus paid search clicks helps the marketing team develop content strategies and other marketing tools for boosting SEO.
- Total organic impressions: Organic impressions refer to the number of times in which a website appeared in a search, which is important for measuring SEO.
- Average organic position: Retail is competitive, and ranking higher means more visibility. If this number is high, a retailer might need to focus on SEO.
- Sum up table with organic data per category: Being able to compare SEO metrics side-by-side is a good way to see the total picture of how a website is performing.
- Number of unique backlinks: When other companies are directing people back to a retailer’s website using backlinks, it helps enhance their credibility. Measuring this metric gives a retailer a sense of its reputation within the industry.
d. Social Media Marketing Metrics
- Total reach: Measuring the number of potential unique viewers for a social media campaign or post helps guide social media strategy.
- Total engagement: An important metric for tailoring messaging, total engagement refers to how many people interacted with each post. Use it to see which messages are hitting the target audience.
- Total clicks to website: A social media campaign’s goal is to drive traffic to the web, so this stat should be in the CMO dashboard.
- Total purchases: Measuring total purchases from each social media campaign offers a more accurate picture of its success.
- Total spending: This metric goes hand-in-hand with total purchases to gauge how well a social media post inspired shoppers to buy.
- Average cost per click: This is the average spending across total clicks on a retailer’s website.
- Total cost/purchase: Use this metric to see how much it costs to drive a purchase.
- Stats per social media network: Add this stat to the dashboard to compare social media performance and revise the overall strategy.
e. Email/WhatsΑpp/Viber/SMS Marketing Metrics
- Total sent: A measure of how many messages were sent in total across platforms.
- Total opens: Refers to how many people opened a message.
- Total clicks: Use this statistic to measure each campaign’s success at driving web traffic.
- Average open rate: With this metric, a retailer can see which messaging app is more successful with its target audience.
- Average click-through rate (CTR): This metric builds on the open rate to measure how many of those customers clicked on links within the message.
- Best campaigns by open rate: Use this metric to determine which messages are most successfully engaging the target audience.
- Best campaign by email revenue: Use this KPI to measure success rates of email marketing.
f. Referral Marketing Metrics
- Top referrers by revenue: If a retailer has an affiliate program or runs a referral campaign, this metric will help them determine their top partners based on revenue.
- Top referrers by traffic: Use this metric to see how many other websites or referral campaigns are driving traffic to a retail site.
Supply Chain & Order Delivery KPIs

These important metrics give the marketing team insights into customer service to help gauge customer satisfaction.
- Average delivery time: Measure how long it takes merchandise to reach customers after they order.
- Average cost per parcel: This metric can help a retailer set shipping rates or offer promotional shipping deals.
- Return rate: Use this metric to see which products might not be up to quality standards or to track success rates of promotional deals.
- Average cost per return: Returns impact a retail business, and it’s important to understand how they impact revenue.
CMO dashboard examples for retailers to follow
Exploring good CMO dashboard examples gives the marketing team an idea of what data they should measure and how they might use the dashboard. It’s not necessary to duplicate the layout of each CMO metrics dashboard. Instead, this section offers an overview of different types of dashboards and how to use them for different marketing goals. Some marketing teams may be interested in a comprehensive picture of their marketing efforts, while others may only be interested in benchmarking campaigns for a specific channel.
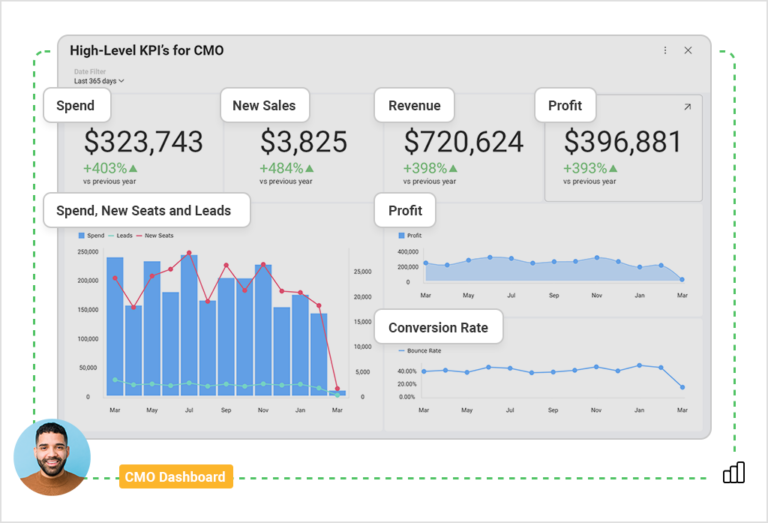
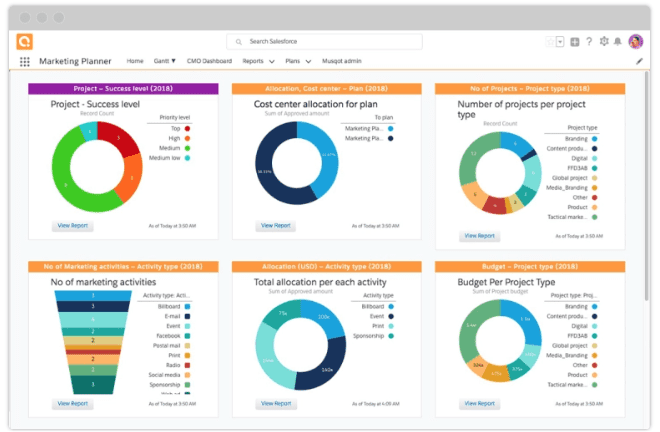
Option 1: the “All-in-one” dashboard

This type of CMO marketing dashboard offers a complete picture of the company. It includes all CMO dashboard analytics in one place. Marketing team members can see one dashboard with each of the most important KPIs per category and get a complete look at their marketing strategy and how it performs.
Pros
- Offers a broad picture of marketing efforts
- Offers the ability to compare marketing channels
- Makes it easy to track overall progress
Cons
- Doesn’t offer an in-depth analysis of marketing efforts
- Can be cluttered
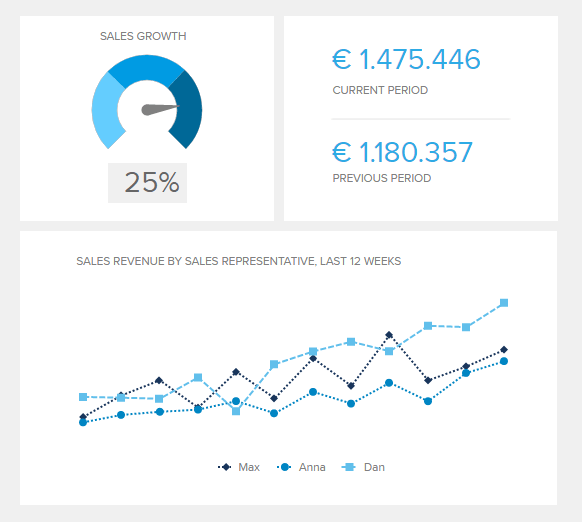
Option 2: the “decentralized” dashboard
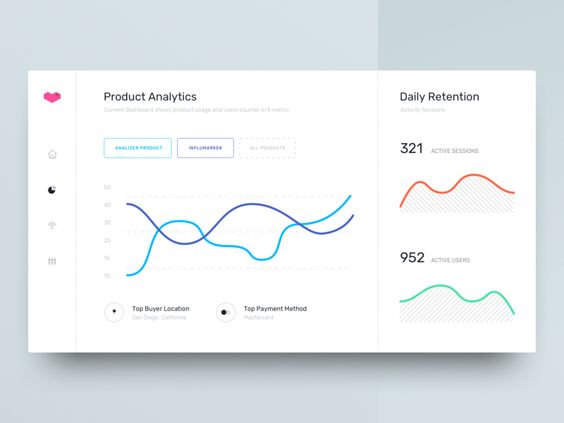
Instead of using a dashboard to evaluate overall marketing efforts, this approach involves creating separate dashboards for each department. Each CMO KPI dashboard would include an executive summary from department heads for a big-picture overview of the report. With this approach, the board and executive team can quickly determine progress on each marketing effort with more data.
Pros
- Offers a more comprehensive picture of marketing efforts
- Makes it easier to benchmark individual campaigns by marketing channel
- Gives more data for decision-making
Cons
- This approach could result in siloed marketing efforts instead of a cohesive strategy
- This dashboard takes more time to consolidate for presentation
Option 3: a “hybrid” CMO dashboard (recommended)
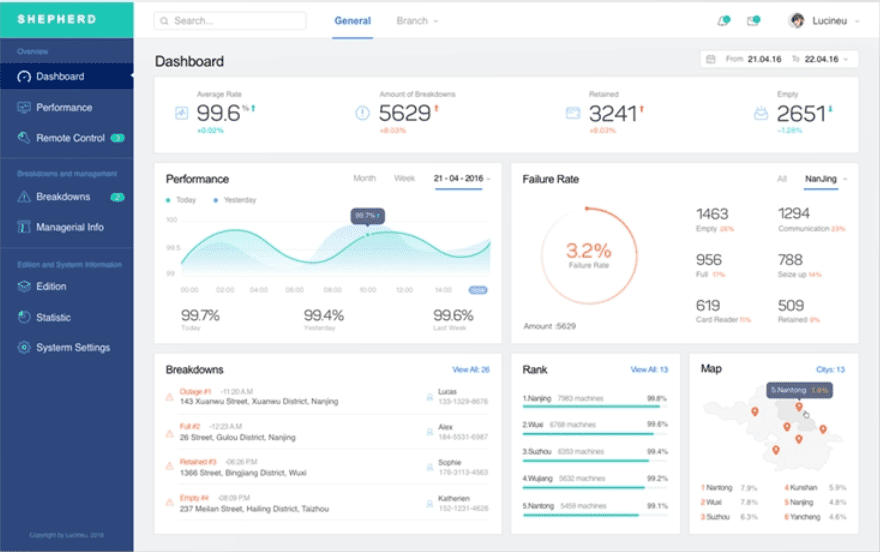
Hybrid CMO dashboard components offer a mix of overall metrics and specific metrics. There is a central dashboard with the most important KPIs followed by multiple dashboards with in-depth information by marketing channel. This approach allows the executive team to determine how marketing efforts perform overall while the marketing team has the data they need to refine their strategies.
Pros
- Offers the best approach for data-driven decisions
- Helps the marketing team understand how their efforts contribute to the company
- Easier to tailor than an all-in-one report
Cons
- May not track fast-moving trends
- This approach also carries a risk of data silos
Finest tools for faultless and fruitful eCommerce reporting
With the right CMO marketing dashboard, any retailer can improve their marketing efforts and drive more sales. Use these tools to create the best CMO dashboard.
Looker (recommended)
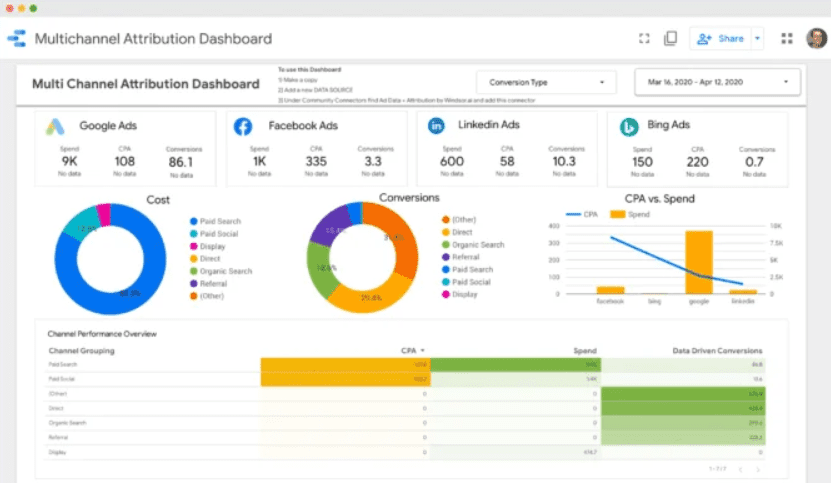
ContactPigeon has partnered with Looker, a business intelligence and analytics platform that offers valuable insights into any retail business. Looker provides a 360-degree view of customer analytics and showcases each touch point and interaction. This platform allows retailers to create visually-appealing dashboards that are easy to read and contain all the most important marketing metrics and KPIs.
It is tempting to use a CMO dashboard template for free, but the result will be less useful. Looker is affordable and intuitive, allowing retailers to create custom dashboards faster.
ERP + Power BI platform

This platform is also robust, providing a holistic view of any retail organization. The data-visualization tools offer detailed reports in a format that is easy to read and interpret. However, ERP + Power BI are expensive and tricky to set up. A CMO probably doesn’t have the time to learn the software when he needs quick access to analytics and insights.
Without data, you’re just another person with an opinion
You know your business inside and out, but without having the correct data, you may be marketing on hunches. A CMO dashboard gives you the hard facts you need to measure your marketing campaigns. Use these insights to determine which marketing channels and strategies are working best and focus on these channels to drive more business or improve the less successful channels.
With ContactPigeon’s tools, you can gain access to complete dashboards that will aid you to drive your marketing strategy and boost your ROI. Book a free consultation to find out how we can help you.

Let’s Help You Scale Up
Spending time on Linkedin? Follow us and get notified of our thought-leadership content: