


At the onset of the COVID-19 outbreak, many governments enforced Stay-at-Home measures that require social distancing for millions and closures of non-essential stores. Unsurprisingly, home confinement forced consumers towards online shopping, as weekly eCommerce sales shot up 61% within the first weeks of the closures. That growth in online sales seems to be the main hope for retailers to retain part of their market share and survive through this crisis.
This report examines the weekly eCommerce sales patterns as a result of stay-at-home measures, which products consumers are purchasing online, and which categories consumers have cut back on, in an effort to map key COVID-19 eCommerce trends and behaviors.

Key Highlights of the COVID-19 eCommerce Report
- The market is shifting. The global COVID-19 pandemic, retail, and eCommerce businesses are facing new challenges in consumer behavior –in total spend, product mix, and where shopping takes place.
- Ecommerce benefited during forced closure. Weekly eCommerce sales during the mandatory store-closure period have increased by 61% compared to the weekly average during the pre-closure period.
- Average order value (€) have grown 31%. The average item per order increased by 60% during this period as consumers opt to add more products in their orders to cover the needs.
- Top 3 eCommerce product categories: Entertainment, Stationery & Hobbies, and Food & Beverages. Consumers tend to favor essential products such as groceries, as well as items that make time at home more fun or productive.
- Bottom 3 eCommerce product categories: Automotive, Home Appliances, and Fashion. Consumers have cut back or postponed on bigger investment pieces or non-essential products during this period compared to before.
An Intro to Our Data Methodology
Data source
The data used within this eCommerce report is sourced from over 30M eCommerce order transactions from January through April 2020 aggregated across a large number of ContactPigeon’s client base. The under data cover all key eCommerce verticals with a bias towards a few specific categories – fashion, food & beverages, beauty & personal care – and geographic region (Europe) given our client coverage.
However, the substantial volume of data used for each eCommerce vertical ensures the statistical significance used to reflect the population’s observed pattern.
Visual Recognition of Products
We are interested in how consumer spending pattern changes over this period by product types. This would allow us to understand performance not by the retail type (e.g., supermarkets, pharmacies) but rather by the product consumers are buying. For example, while supermarket sales have grown overall, we can now pinpoint the product types that driving up the volume and those that have lagged.
A significant challenge to accurately gathering data on product category level is the immense inconsistency on product naming and categorization across retailers. The same product may carry different names from one vendor to another.
To overcome this, we adopted AI visual recognition to assign a product to its rightful and standardized category based on the product images. A large number of products are categorized intelligently with this algorithm. When the AI runs into trouble, our data team manually checked and assigned the category, therefore gradually “teaching” the AI to better “learn” how to categorize the products.
As a result, ContactPigeon built a substantial database of over 100K products with standardized category tags. A feat indeed!
Increased eCommerce Sales During Quarantine Measures
Compared to weekly eCommerce results in January and February 2020, online sales jumped up significantly during the initial period of the government enforced quarantine. Overall, weekly online sales have shot up by an average of 61% compared to the pre-quarantine period.
Here is a week by week view of the impact by the quarantine measures:
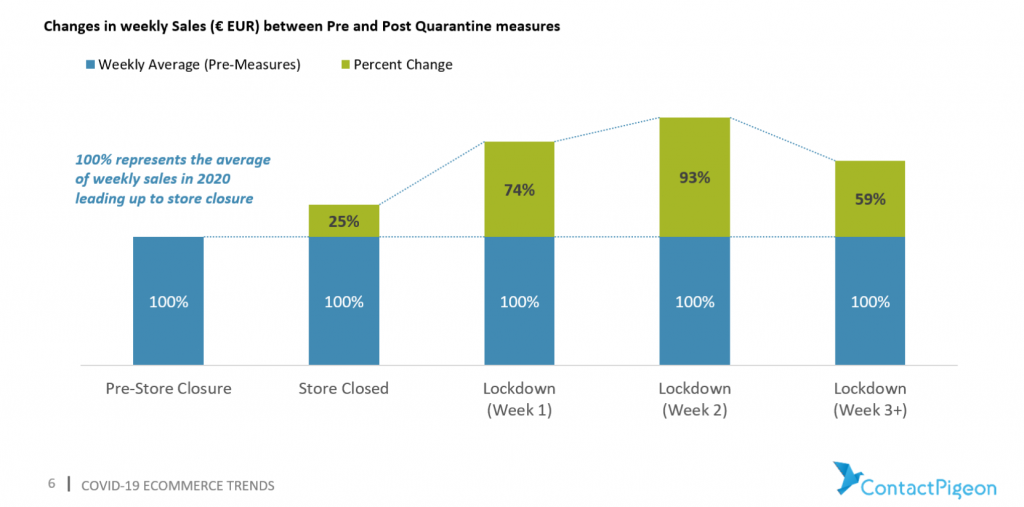
The increase has been most prominent during the first three weeks of the lockdown period. Once the initial shock of store closure subsides, the weekly spend for online orders increased by 74% and 93% of pre-quarantine periods, as consumers rush to stock up on necessities and other goods that are no longer available via physical shops.
The uplift in online orders is not just reflected in numbers of orders, but overall items per order and average order value as well. Across all retail categories, average items per order grew 60% from the pre-closure period, while average order value has gone up by 30%. This suggests that quarantine measures are pushing households to purchase more items online, fulfill bigger orders, yet spend less on a per-item basis on average. For instance, consumers are adding lower value products such as groceries or products that are normally purchased in physical shops.

Consumer Behavior: Shifts in Product Choices During Pandemic
The purchasing behavior not only shifted from offline to online but also in the types of products consumers are buying. This shift can be seen in the changing percentage each product category comprises as part of total sales before and after the quarantine measures are introduced.

The categories with the biggest increase in shares of overall spend are Consumer Electronics and Food & Drinks. While Fashion, Beauty & Personal Care products have seen a relative decline in its shares.
Three elements play a role in influencing the shift here: raw demand, the maturity of eCommerce as a channel prior to COVID-19, and availability of the product in the physical store. For example, Food & Drinks, a category that’s traditionally purchased offline rather than online have seen an increase in eCommerce as more people avoid supermarket visits during the period. However, the data point does not reflect the real increase in Food & Drinks (as reported in numerous reports on consumer hoarding behavior) since supermarkets in most countries remained open to the public throughout this period and limited fulfillment of online orders by most grocery chain.
Winners & Losers from the Stay-at-Home Period
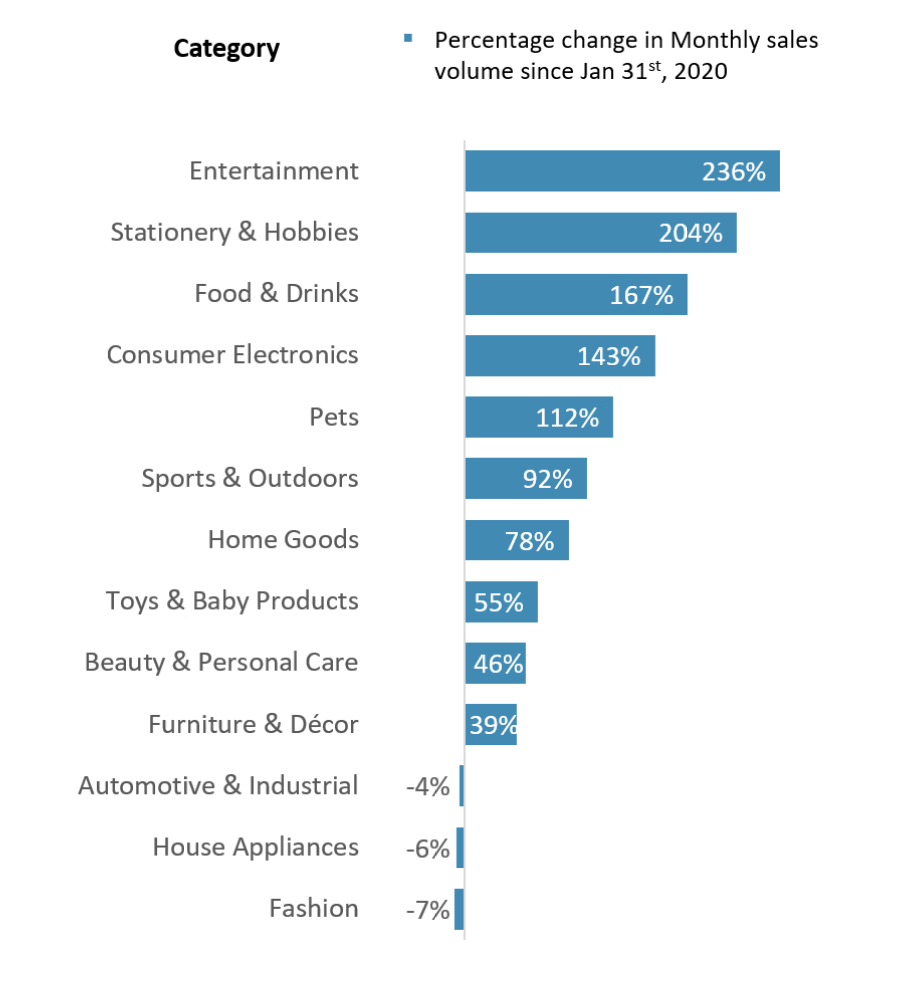
By comparing changes in monthly online sales volume by each category, the top 3 types that gained sales are:
- Entertainment
- Stationery & Hobbies
- Food & Beverages
The categories that suffered the most significant drop in sales:
- Automotive & Industrial Parts
- Home Appliances
- Fashion & Apparel

With the majority of the population confined to home, consumers tend to opt for essential products (food & beverage) and those that can make time spent at home more enjoyable (including entertainment products such as gaming, videos, and software, as well as stationery & hobbies).
Consumers choose to put off investing in large ticket items such as automotive parts and home appliances during this period. Consumers are also delaying purchases in fashion products as demand for new apparel dropped amidst stay at home.
The New Normal
As quarantine is gradually lifted country by country, many consumers are reluctant to return to the old shopping ways for fear of getting sick. Approximately 24% of consumers said they wouldn’t feel comfortable visiting a shopping mall within the next six months by a Morning Consult survey.
It’s likely that households will continue to turn to eCommerce for necessities such as groceries, apparel, and entertainment. This preference will likely develop and reinforce new online shopping habits for millions of consumers long after the COVID-19, hence redefining the retailing landscape.
The next generation of retailers can overcome the friction of this shifting demand, with capabilities that can cater to consumer omnichannel experience across all digital and offline channels in a seamless fashion. If you are an eCommerce retailer, it will also be extremely helpful to attend big eCommerce events like Shoptalk, in order to keep up with all the new trends that are coming up in the post-Covid-area.
In the months to come, we will publish more eCommerce reports in an effort to understand best how has COVID-19 affected eCommerce. Stay tuned!
Update: We asked 34 eCommerce and retail professionals to tell us how they have adapted their marketing strategy to see how COVID-19 has impacted their marketing mix. You can read the findings here.