

Cyber Monday, along with Black Friday, is one of the most anticipated events of the year for retailers and consumers. Cyber Monday takes place the Monday following Thanksgiving and features unbeatable online discounts on numerous products from well-known retailers. Although Cyber Monday has always been popular amongst consumers, it gained notable traction following the pandemic, with a 15% increase in overall online sales from 2019 to 2020. Last year, in 2023, 73.1 million consumers shopped online and 20.9 million people shopped in person, taking advantage of the Thanksgiving promotional offers, and discounts. With all that in mind, taking a deeper look at some BFCM statistics can prove quite beneficial for your strategy this year. The data will allow you to understand and predict consumer behavior, tailor your approach to fit the needs of consumers and ensure the overall success of your Cyber Monday efforts for 2025.
ContactPigeon’s Picks: The top 10 most impressive Cyber Monday statistics
Cyber Monday is an opportunity for retailers to bring in new traffic, further build relationships with returning customers, and contribute to the overall increase of their YoY sales. Every year, the statistics show just how impactful this event is for retailers, both big and small. Understanding some of the most impressive statistics about Cyber Monday in the previous years will allow retail executives to optimize their 2023 Cyber Monday strategy and plan accordingly.
- The $3 billion increase from Cyber Week 2022 to Cyber Week 2023, highlights a highly successful year. Shoppers clearly spent significantly more. (Stacked Marketer)
- 86% of shoppers planned to buy something in BFCM 2023.
- Brands have to be prepared and ensure seamless online experiences, given that 48% of shoppers intend to make online purchases.
- Prioritize a mobile responsive shopping experience since over half of the respondents indicated using mobile devices for their online shopping.
- A majority of consumers, 56%, plan to spend the same amount or less compared to Cyber Week 2022.
- 88% of the leading 50 online retailers provide discounts and offers for Cyber Monday.
- Adobe Analytics states that consumers spent a remarkable $12.4 million on Cyber Monday and $38 billion on Cyber Week 2023.
- According to Shopify, between Black Friday and Cyber Monday, Shopify merchants collectively generated an impressive $9.3 billion in sales.
- Product reviews will likely have an impact on 4 out of 5 millennials.
- The average American citizen typically spends around $500 during Cyber Week, which includes major shopping events like Black Friday and Cyber Monday.
General Cyber Monday Statistics
Cyber Monday is a piece of a larger puzzle known as Cyber Week. Once Cyber Monday showcased its potential for overall retailer growth, retailers began using Thanksgiving week to promote online deals, along with their in-person efforts like Black Friday. However, Cyber Monday has remained strong as a leader across all of Cyber Week, bringing in notable statistics showing retailers the importance of partaking in this event.
- During Cyber Monday sales, the most commonly purchased items include toys (44%), electronics (66%), and appliances (36%).
- The sales of toys on Cyber Monday increased by a remarkable 684% in comparison to an average day in October.
- 43% of customers choose to buy electronics during Cyber Monday and Cyber Week.
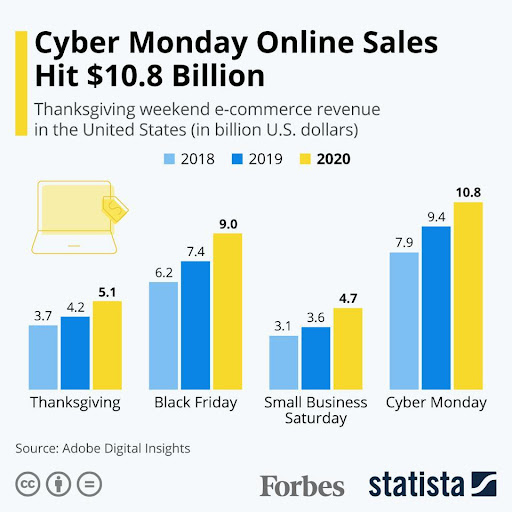
- There was a 15.1% increase in revenue from 2019 to 2020 Cyber Monday. (Adobe, 2020)
- In 2020, traffic to brick-and-mortar stores was down by 42.3% during Cyber Week. (Forbes, 2020)
- During the peak hours of Cyber Monday 2020, the buying rate reached $12 million per minute (C.B.S. News, 2020)
- The median discount given by the top 50 brands is 50%. (Digital Commerce 360, 2021)
- Cyber Monday and Black Friday lead acquisition to be increased by 180% compared to regular shopping days. (Socital, 2020)
- The traffic to brick-and-mortar stores was down by 42.3% during Cyber Monday 2020. (Forbes, 2020)
- On average, consumers spent $431 on Cyber Monday 2019. (Blippr, 2020).
Historical Cyber Monday Statistics
Beginning in 2005, Cyber Monday has not slowed down its growth, continuing to be one of the most popular online shopping days of the year. Although it has seen tremendous growth in our digital age, its history holds stats that showcase its potential from its early days.
- Cyber Monday sales in 2018 amounted to $7.9 billion, with part of this success attributed to the availability of Black Friday sale items that had sold out. The sold-out products were reintroduced again on Cyber Monday, giving consumers a second opportunity to access some of the best deals.
- Although Cyber Monday originates in the US, it currently involves the participation of 28 countries, with the highest level of awareness observed in the United Kingdom, reaching 89%.
- The decline in sales at physical stores during Cyber Week 2020, brought a record $10.8 billion in online sales by the end of Cyber Monday.
- Cyber Monday began in 2005 and was created by the National Retail Federation. (Reader’s Digest, 2021)
- Even after The Great Recession hit, Cyber Monday sales continued an upward trend, hitting $846 million in 2008. (Comscore, 2008)
- Cyber Monday spending hit $1 billion for the first time in 2010. (CNN Money, 2010
Cyber Monday U.K. Statistics
Although the United States is the primary leader in all things for Cyber Monday, other countries have begun participating in this annual retail event. Europe is a leader in this event behind the U.S., with the U.K. being one of the most notable countries, as its shoppers partake in the savings at a growing rate.
- In 2022, British consumers collectively spent 8.71 billion GBP on Black Friday and Cyber Monday, with 4.81 billion occurring online. (bigblue)
- Approximately 73% of UK consumers indicated that they are planning to allocate a greater portion of their gift purchases to Black Friday and Cyber Monday in the UK in 2022, as compared to 2021. (Statista)
- 89% of U.K. shoppers are aware of Cyber Monday, which puts them in the lead for Europe. (Statista, 2022)
- Cyber Week sales in the U.K. increased by 146% in 2020, placing them at the 2nd spot in overall global sales. (BigCommerce, 2020)
- The peak time for online traffic on Cyber Monday was 9:00 p.m. in 2021. (SaleCycle, 2022)
- 56.2% of online products were sold via a mobile device on Cyber Monday. (SaleCycle, 2022)
Cyber Monday U.S.A. Statistics
Topping the charts for the eCommerce holiday season is the United States, where Cyber Monday has seen record-breaking numbers over the years. Although it competes with other holiday retail events, like Black Friday and Small Business Saturday, Cyber Monday continues to prove how influential online sales are for consumers during the holiday season. Some of the most noteworthy statistics that the U.S. has seen in recent years include:
- On Cyber Monday 2023, spending increased by 43% in the US.
- On Cyber Monday, buyers spent a total of $12.4 billion in the United States.
- 68% of shoppers are planning to visit one or more retailers in BFCM 2024.
- U.S. online sales during Cyber Weekend 2020 totaled $34.4 billion. (Forbes, 2020)
- 25% of the total Cyber Monday revenue was generated during just four hours in 2020, contributing to its record-breaking numbers. (Practical Ecommerce, 2020)
- In 2020, the U.S. led all countries in gross merchandise volume, experiencing a 67% growth. (BigCommerce, 2020)
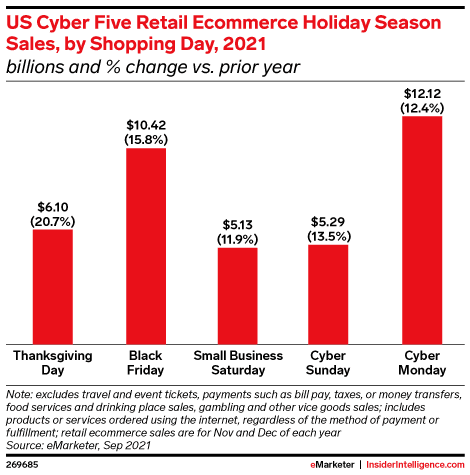
- In 2021, Cyber Monday was among the biggest spending days in the U.S., with $12.12 billion spent. (Insider Intelligence, 2021)
- The average discount during Cyber Week 2021 was 26% in the U.S. (Salesforce, 2021)
Cyber Monday Statistics of Other Countries/Regions
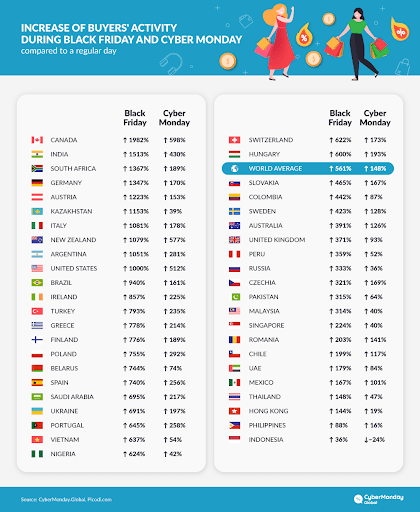
The U.S. and U.K. may distinguish on Cyber Monday shopping, but that doesn’t mean that the rest of the world is blind to the world of holiday savings. With the exception of Indonesia, countries that participate in Cyber Monday sales have seen an increase in overall buyer activity compared to regular shopping days. Statistics that further show the impact that Cyber Monday has on eCommerce activity in other countries include:
- The average discounts offered during Cyber Week are 30% in the United States and 27% globally. (Exploding Topics)
- In 2023, 196.7 million US shoppers bought something shopped during Cyber Week. (Exploding Topics)
- 81% of shoppers decide their purchases based on sales and promotions.
- Twenty-eight countries celebrate Cyber Monday. (Investopedia, 2022)
- Since the beginning of the pandemic, 70 million more people have shopped online in Southeast Asia. (CNBC, 2021)
- This same report predicts that the number of online shoppers in Southeast Asia will reach 380 million by 2026. (CNBC, 2021)
- Spain and Israel saw the lowest conversion rates during Cyber Monday 2020, with Spain having a 1.09% conversion rate and Israel having a 1.42% conversion rate. (Barilliance, 2020)
- Great Britain and Australia had the two highest conversion rates at 3.02% and 2.7%. (Barilliance, 2020)
- French retailers saw a 201% increase in sales on Cyber Monday compared with sales during the first four weeks of October. (Criteo, 2020)
- Cyber Monday sales in Australia rose 223% from 2019 to 2020. (CyberMonday Global, 2020)
Cyber Monday Retail Statistics
Retailers constantly seek new strategies and campaigns to stay ahead of competitors and increase their YoY revenues. Cyber Monday is an excellent opportunity for retailers to challenge themselves and their competitors yearly. Looking at and making sense of statistics from previous years will allow retailers to tailor their Cyber Monday strategy to fit the consumer’s needs.
- In 2023, customers spent $38 billion during Cyber Week, despite all the talks about cutbacks.
- On Cyber Monday 2023, 67% planned to shop online during BFCM, and 27% in-store.
- Adobe Analytics reported that Cyber Monday 2023 set a new record as the largest online shopping day in history, with unprecedented use of Buy Now, Pay Later (BNPL) services. This surge is largely due to Cyber Monday being exclusively focused on online deals, unlike Black Friday. (Stacked Marketer)
- 4 out of 5 retailers run lead acquisition campaigns during Black Friday and Cyber Monday. (Socitel, 2020)
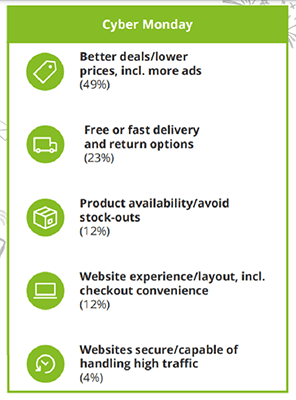
- 49% of Cyber Monday 2020 shoppers wanted to see better deals and more ads from stores leading up to the sales. (Deloitte, 2020)
- 23% of these shoppers prioritize fast and free delivery and return options. (Deloitte, 2020)
- 88% of the top 50 retailers offered deals for Cyber Monday 2020. (Digital Commerce 360, 2020)
- Large retailers saw a 486% increase in Cyber Monday sales in 2020. (Retail Dive, 2020)
- Items discounted by the highest percentage were electronics during Cyber Monday 2021. (Adobe, 2021)
Cyber Monday eCommerce Statistics
Once shoppers recognized the ease of shopping online after the pandemic, retail events like Cyber Monday became a very attractive option, especially compared to its counterpart, Black Friday.
- Online holiday sales in 2023 saw a 7.3% increase compared to 2022.
- On Cyber Monday, 88% of the top 50 online retailers provide discounts.
- In the United States, Amazon was the most popular online retailer for Cyber Monday 2023, chosen by 88.3% of respondents.
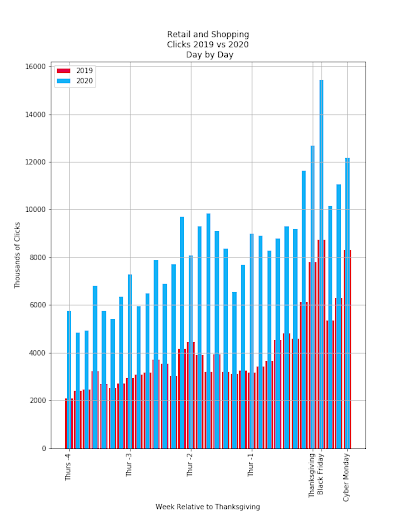
- Clicks on the sites of digital retailers went up by 46% on Cyber Monday in 2020 (ClickZ, 2020)
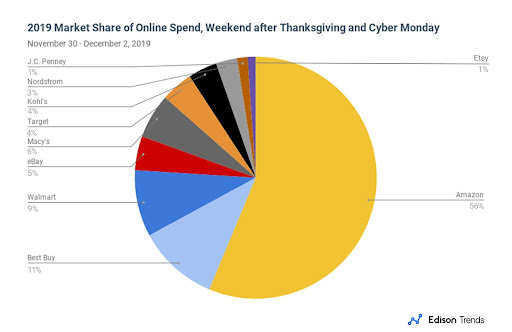
- Amazon holds the largest market share among this event’s online sellers at 56%. (Edison Trends, 2019)
- Shopify generated more than $5.1 billion in sales during Cyber Week 2020, seeing a 76% increase from 2019. (Shopify, 2020)
- Amazon also experienced a high number, with its merchants collecting more than $4.8 billion, a 46% increase from 2019. (Amazon, 2020)
- During the final hours of Cyber Monday 2022 (7 p.m.–11 p.m. PST), consumers are expected to spend 30% of the day’s total revenue. (Inc., 2022)
- Experts are predicting that inflation, labor shortages, and supply chain issues will impact online shopping for Cyber Monday 2022. (Yahoo! News, 2022)
Cyber Monday Sales Statistics
Sales statistics are arguably one of the most important to pay attention to as a retailer that partakes in Cyber Monday. These sales stats give retailers insight into what products are bringing in revenue, how successful aspects of a Cyber Monday campaign are, and how to improve on them in the future to contribute to the bottom line. Some of the most notable sales statistics from recent Cyber Monday include:
- In 2023, smaller retailers experienced a remarkable 501% increase in sales.
- During Cyber Monday 2023, 79.4% of males and 63.1% of females planned to buy electronic products. (Lovie Awards)
- Clothing purchases during Cyber Monday 2023 were more common among females (63.6%) than males (50%). (Lovie Awards)
- In 2023, 43% of Cyber Monday sales in the U.S. were made through mobile phones.
- Top sellers for Cyber Monday 2021: AirPods, Hot Wheels, Nintendo Switch, laptops, and T.V.s. (Adobe, 2021)
- Top sellers for Cyber Monday 2020: “Super Mario 3D All Stars,” AirPods, Vtech toys, H.P. and Dell computers, and Chromecast. (Adobe, 2020)
- Top sellers for Cyber Monday 2019: Nintendo Switch, V.R. devices, Samsung T.V.s, “Frozen 2” toys, and L.O.L. Surprise Dolls (Adobe, 2019)
- Cyber Monday 2019 has an average conversion rate of 7.75%. (Socital, 2019)
- For Cyber Monday 2019, Amazon held the largest market share at 56%, followed by Best Buy (11%), Walmart (9%), Macy’s (6%), and eBay (5%). (Edison Trends, 2019)
- Cyber Monday 2020 held the biggest discounts during holiday sales, with a median discount rate of 29%. (Digital Commerce 360, 2020)
Cyber Monday Shopping Behavior Statistics
Customers drive every campaign a retailer puts on and ultimately determine the campaign’s outcome. Cyber Monday is not different, and consumer behavior during this retail event should be considered when planning the overall campaign strategy. Some of the customer behavior stats to consider for your Cyber Monday 2022 campaign include:
- In 2023, about 23% of consumers are expected to spend over $1,000 on Cyber Monday, with other spending categories breaking down as follows: less than $200 (13%), $200 to $399 (18%), $400 to $599 (22%), $600 to $799 (13%), $800 to $999 (9%), and 2% planning no spending. (Lovie Awards)
- More than 27% of Gen X, 17% of Baby Boomers, and 24% of Millennials and Gen Z are likely to spend over $1,000. (Lovie Awards)
- 37% of Cyber Monday 2020 sales were made through mobile devices. (N.B.C. News, 2020)
- Mobile phones accounted for 42% of all Cyber Week 2021 purchases. (Big Commerce, 2021)
- iPhone users placed 122% more orders than Android users on Cyber Monday 2021. (Big Commerce, 2021)
- The conversion rate of smartphone shoppers during Cyber Monday 2020 was 3.31%. Laptops and other devices had a rate of 7.2%. (Adobe, 2020)
- 56% of shoppers anticipate holiday deals from Amazon, with Target following closely behind (41%), along with Walmart (31%), Best Buy (22%), Kohl’s (21%), and home improvement stores (19%). (BlackFriday.com, 2021)
- During Cyber Week 2020, Cyber Monday customers paid the lowest for electronic products compared to shoppers who purchased electronics on other days of the week. (Adobe, 2020)
- A 2020 report showed that 91% of shoppers have changed their shopping habits due to the pandemic, with 58% of them preferring to shop online. (The Patriot Ledger, 2020)
- The average amount people spent on Cyber Monday 2020 was $312, which was a 14% decrease from 2019. (The Washington Post, 2020)
- On Cyber Monday 2021, usage of BNPL (Buy Now Pay Later) services saw an increase, with revenue up 21% YoY. (Adobe, 2021)
- Around 37% of male consumers planned to shop in stores on Cyber Monday 2021. (Icoinical, 2022)
- People aged 33 to 44 are most likely to shop during Cyber Week. (Icoinical, 2022)
- Nearly half of consumers (45%) sought one-day shipping for last-minute purchases during Cyber Monday 2019. (Adobe, 2021)
Cyber Monday VS. Black Friday Statistics
Cyber Monday and Black Friday go hand in hand for retailers, especially those who utilize an omnichannel approach, offering both online and in-store shopping experiences for shoppers. In years past, they have often been very close in terms of overall success and contribution to retailers’ revenue and YoY growth. If you are planning to participate in both of these retail events, some of the Black Friday and Cyber Monday stats you will want to consider include:
- In 2023, Black Friday sales reached $16.4 billion, showing a 9% year-over-year growth, whereas Cyber Monday generated $12.6 billion in sales, with a 3% increase compared to the previous year. Overall, Cyber Week brought in $70.8 billion, marking a 5% year-over-year growth. (Lovie Awards)
- Men are more inclined to shop on Black Friday, with 78% participating compared to 62% of women. Additionally, on Cyber Monday, 79% of men purchase electronics, compared to 64% of women. (Lovie Awards)
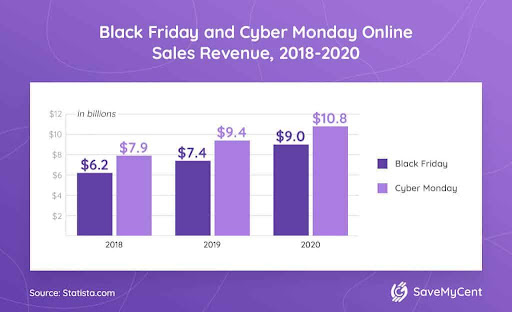
- Online shoppers spent $9 billion on Black Friday in 2020, while Cyber Monday saw $10.8 billion in revenue. (Adobe, 2020)
- 58% of online Black Friday sales were made through a desktop. (Adobe, 2020)
- 108 million people reported they planned to shop on Black Friday 2021 in the U.S. (Statista, 2021)
- 62.8 million people reported that they planned to shop on Cyber Monday in 2021. (Statista, 2021)
- The total revenue for Black Friday 2020 was around $188 billion. (Adobe, 2020)
- In 2019, 83.3 million people shopped online on Cyber Monday (compared to 93.2 million shoppers on Black Friday). (Retail Dive, 2019)
- For Cyber Monday 2020, 30% of shoppers planned to shop Cyber Monday sales, higher than the 24% of shoppers planning to shop Black Friday sales. (BlackFriday.com, 2021)
- In 2019, Black Friday beat out Cyber Monday in overall sales, with B.F. bringing in 84.2 million shoppers, compared to Cyber Monday’s 21.8 million. (N.R.F. , 2019)
- Cyber Monday 2019 dominated eCommerce revenues with $9.4 billion, compared to Black Friday’s $7.4 billion. (Adobe, 2020)
- Cyber Monday is expected to see growth at a rate of 5.1% YoY and a record-breaking $11.2B in revenue. (Footwear News, 2022)
- Black Friday is expected to experience a low growth rate of 1.0% YoY and $9B in revenue. (Adobe, 2020)
Other insightful marketing statistics resources for retailers
- 75 Halloween statistics and facts every retailer should consider
- The 50 most important Mother’s Day statistics for retailers
- Black Friday statistics: The 80 most important stats for retailers
- Retail Statistics: the 100 Most Insightful Stats You Shouldn’t Ignore
- Retail Customer Engagement Statistics: 55 Stats You Need to Know
- Marketing Automation Statistics for eCommerce
- 56 Christmas Marketing Statistics to Know for This Holiday Season
- 50 Father’s Day Statistics No Retailer Should Miss
FAQs about our Cyber Monday Statistics
Is Cyber Monday successful?
Cyber Monday stands as one of the most successful shopping holidays, marking the pinnacle of online sales for the year. In 2022, this day raked in an estimated $11.3 billion in sales in the United States alone. Since its inception in 2005, Cyber Monday has gained immense popularity among Americans and has spread all over the world.
What sells the most on Cyber Monday?
Retailers convert shoppers with substantial discounts, leading to increased sales across a wide range of categories, including toys, sporting goods, appliances, books, jewelry, electronics, and computers. The results of Cyber Monday serve as a valuable gauge for the overall economy, as consumers predominantly shop for discretionary items on this occasion.
What is the record of Cyber Monday?
Cyber Monday 2023 is projected to experience the most substantial growth throughout Cyber Week, with anticipated record-breaking sales of $13.7 billion. Last year in 2022, Salesforce data revealed that the worldwide online holiday sales throughout Cyber Week, encompassing Thanksgiving to Cyber Monday, soared to an impressive $281 billion, reflecting a 2% year-over-year increase.
How many people participated in Cyber Monday?
Over the Cyber 5 holiday period, more than 122.7 million consumers opted to shop in physical stores, marking a notable 17% rise from the 105 million shoppers in the previous year. According to a study conducted by Drive Research, 64% of US consumers expressed their intention to partake in Cyber Monday shopping in 2022, showcasing a substantial 42% increase from 2021.
Is Cyber Monday big?
Indeed, Cyber Monday is a very important occasion within the eCommerce and retail sector. It has evolved into one of the most lucrative days of the year for retailers, surpassing even the traditionally significant Black Friday. Retailers thrive on the buzz surrounding Cyber Monday, making it the busiest day of the entire holiday shopping season. This day instigates a remarkable upsurge in online shopping, resulting in increased sales volume and, consequently, higher revenue.
How long will Cyber Monday last?
Cyber Monday is officially a 24-hour event, starting at 12:00 a.m. on Monday and concluding at 11:59 p.m. the same day. Nevertheless, several online retailers have extended the concept with what they call a “Cyber Monday week,” and the period from Black Friday to Cyber Monday is frequently referred to as “Cyber weekend,” featuring increasingly substantial discounts as the sale advances. In addition, retailers may choose to extend their sales beyond Cyber Monday, often offering Cyber Week deals and holiday sales as part of the extended shopping period.
Should any retailer run both Black Friday and Cyber Monday?
Yes, participating in both Black Friday and Cyber Monday sales events can be very advantageous for retailers. Both occasions provide opportunities for retailers to boost sales and revenue, acquire and retain customers, clear out old inventory, enhance brand visibility, and gather valuable data and marketing insights. Traditionally, Black Friday primarily revolves around in-store shopping, whereas Cyber Monday is centered on online shopping. Consequently, retailers can reap the rewards by offering deals for both events, thus accommodating the diverse shopping preferences of consumers.
Turn the Cyber Monday Statistics into Growth
On this day alone, records have been broken, with both physical and online shopping activity being at an all-time high. Based on the statistics, it does not look like Cyber Monday will be slowing down anytime soon. Since then, retailers have seen an upward trend of overall revenue on both Black Friday and Cyber Monday. These statistics should not be taken lightly by retailers, as they give insights into the strategies that have worked in the past, as well as consumer behavior that can dictate how to do better in the future.
It goes without saying, that this is a prime opportunity for retailers to use these data to optimize their strategy and drive conversions this Cyber Monday 2023. When it comes to growing as a retailer, we understand that taking statistics and applying them to your current and future marketing strategies can be challenging, so our team is ready to help you plan and prepare for Cyber Monday 2023. Book your free consultation today and learn more about how you can take full advantage of this holiday season.