

Every marketer needs to be in the know-how of the latest eCommerce statistics in order to ride the wave of ever-changing trends. By knowing what your consumers are looking for, you will have all the information and tools you need to set up your brand for success with a solid eCommerce marketing strategy.
In 2018, eCommerce progressed on a global scale, and the proof, is in the pudding. In 2018, we witnessed technology and marketing automation soar to new heights and achieve record-breaking Black Friday weekend sales totaling $18 billion in turnovers — just in the United States alone! ECommerce sales saw a 23% increase over the same 24-hour period in 2017!
During 2020, eCommerce helped many industries and companies survive, swifting consumer’s behavior as well in many cases.
And, if that’s not enough to get you pumped up about the strides eCommerce made, consider that email marketing is on fire (in a good way). In fact, 49% of consumers said that they would like to receive promotional emails from their favorite brands on a weekly basis. What does this mean for savvy online retailers? You need an awesome and inviting email campaign to promote your brand using all of the latest stats and trends. Sounds simple enough, right? So, where do you start? Don’t fret. Read on…
In this post, we are providing you with some of the most interesting eCommerce statistics of 2018 and the insights you need to soar to success in 2021 – 88 of them to be exact! So, sit tight and enjoy the ride…you’re about to surf the wave of the most amazing eCommerce Statistics of 2021 to help you develop an out-of-this-world marketing strategy!
Global eCommerce statistics

eCommerce sales statistics
- In 2019, eCommerce sales are projected to reach $3.453 billion
- By 2040 an estimated 95% of purchases will be made online
- According to Shopify, eCommerce sales are expected to nearly double to $4.5 trillion by 2021!
- Millennials and Gen Xers are the biggest online shoppers, with 67% of millennials and 56% of Gen Xers preferring to shop online versus in brick-and-mortar stores
- Fun fact:43% of online shoppers have reported making purchases while in bed, 23% at the office, and 20% from the bathroom or while in the car
- Men spend 68% more online than women
- In 2018, eCommerce sales accounted for 11.9% of all retail sales worldwide
- The average eCommerce conversion globally is at 2.86%
eCommerce returns statistics
- Over 67% of shoppers will check the returns page before making a purchase
- Return rates from eCommerce sales are 2 to 4 times greater than in brick-and-mortar retail
- 62% of consumers are more likely to purchase online if they can return an item in store
eCommerce email marketing statistics
- Email marketing has a 4,400% ROI, meaning you can earn $44 in revenue for every $1 you spend
- By simply adding personalized subject lines to your emails, they are 26% more likely to be opened!
- By implementing a segmented email marketing campaign you can skyrocket your business to achieving as much as a 760% increase of revenue!
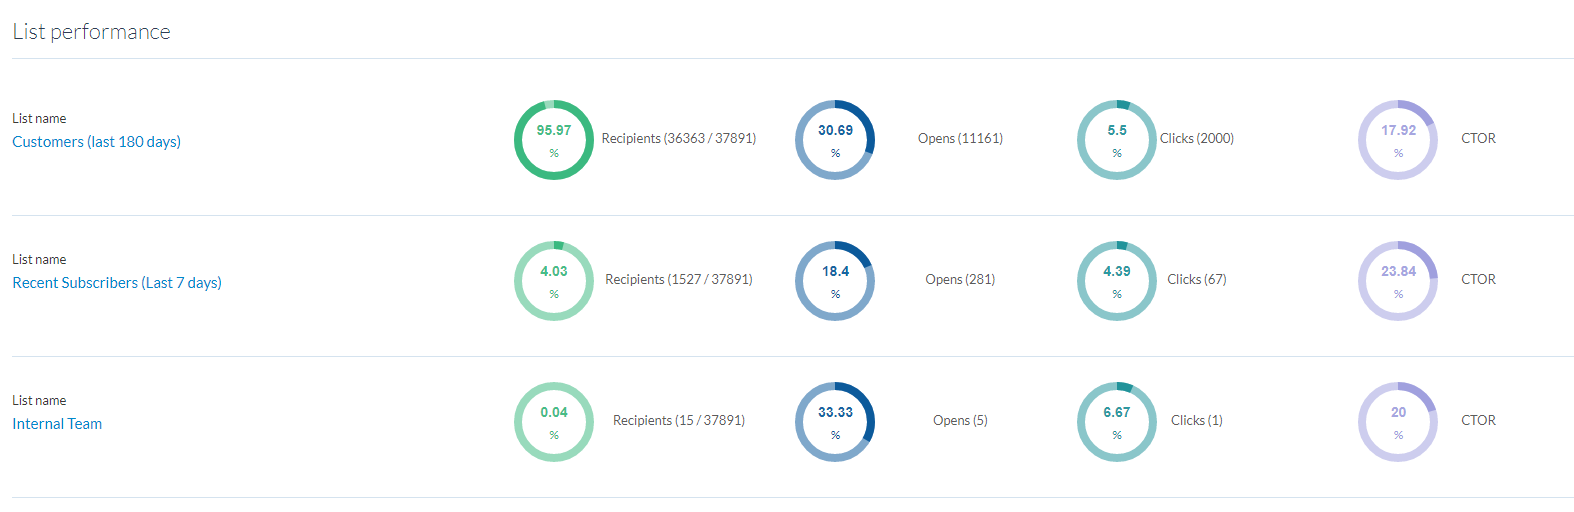
ContactPigeon email campaign performance dashboard breaks down results by recipient list.
eCommerce marketing automation statistics
- 49% percent of companies are using some form of email marketing automation
- Trigger-based email marketing campaigns can generate 4x more revenue and 18x greater profits than traditional email campaign
- Abandoned Cart Recovery Emails are a powerful tool to recover sales as nearly 40% of all cart abandonment emails are opened
- Over 10% of Abandoned Cart Recovery Emails are clicked
- 30% of those Abandoned Cart Recovery Emails clicked lead to an order back on site
- 60% of online shoppers abandon their carts due to unexpected or hidden extra costs
- Email marketing campaigns still outperform Twitter and Facebook by generating 174% more conversions!
eCommerce delivery statistics
- 66% of shoppers buy products from one retailer in preference to another because the delivery services offered were more appealing
- 96% of shoppers say a positive delivery experience makes them loyal to shop with a retailer again
- 77% of consumers want guaranteed weekend or after hours shipping
- 61% of shoppers would prefer 1 – 3 hour shipping
- 80% of shoppers are looking to receive same-day shipping options
- An astonishing 82% of shoppers want to be able to do in-store pick-ups at a brick-and-mortar for their eCommerce purchases
- Having a guaranteed delivery date is important when checking out online for 48% of consumers
- Around 50% of shoppers are willing to pay a premium to ensure faster shipping due to time-sensitive personal reasons
- 46% of online shoppers abandon a shopping cart due to a shipping issue — such as a delivery time that was too long or not provided
eCommerce marketing statistics
- 98% of your visitors leave your website without doing anything
- 75% of your visitors add items to their cart only to abandon before purchasing
- There were $1.66 billion global digital buyers in 2017
- About 21.8% of the global population buys online, and by 2021, the number is expected to rise to over 2.14 billion
- Mobile is growing: In Q3 2018, smartphones accounted for 61% of retail site visits worldwide but generated only 45% of online shopping orders
- Exit-intent campaigns convert an average of between 2-4% of abandoning visitors
eCommerce conversion statistics

- Up to Q3 2018, 2.42% of eCommerce website visits converted into purchases
- Abandoned Cart Emails sent within 20 minutes have an average conversion rate of 5.2%
- Emails sent within an hour have an average conversion rate of 4.5%, while emails sent 24+ hours after cart abandonment only converts at an average of 2.6%
eCommerce statistics by country
USA
- US eCommerce revenue is estimated by Statista to amount to $560,747 million in 2019
- From 2017 to 2018, eCommerce in North America grew by 16% and is expected to grow at a year-on-year rate of 15%
- US ecommerce conversion rate is at 2.63%
- The eCommerce US return rate was $400 Billion in returns in 2017 (+53% over 2 years)
- 10% of holiday sales are returned — In fact, December 26th is the biggest day for returns
- Returns from brick-and-mortar purchases are at an average of 8%… while eCommerce returns can reach as high as 15% to 30%
- In the US, online shopping already accounts for 10% of retail sales in 2018, and eCommerce will soon grow to account for 15% of all specialty retail sales in North America
- US share of ecommerce market sales for 2019 is predicted to be 17.6%
- More Americans prefer online shopping than shopping in a physical store, with 51% of them clicking through to purchase
- A total of 96% of Americans have made at least one online purchase in their life, with 80% doing so in the last month alone
- For eCommerce, the market’s largest segment is Toys, Hobby & DIY with a volume of $172,422 million in 2019
UK
- In November 2018 eCommerce retail sales as a proportion of all retail exceeded 20% for the first time ever
- mobile sales are predicted to continue to grow in the UK, accounting for 56% of all online sales by 2021
- In the UK, eCommerce grew to 15.6B euros in 2017
China
- eCommerce accounts for 23% of all retail in China
- In China, Social Buying is already standard — with 55% of social app users reporting buying goods or services directly on a social app
- China is #1 of the Top 10 Largest eCommerce Markets in the world — totaling $672 billion!
Australia
- In 2017 Australians spent $1.95B per month shopping
- The annual online retail growth rate in Australia is 6%
- Australia’s online market size is 7.3% for the retail sector
Africa
- It is projected that eCommerce will be worth $75B by 2025 in Africa’s leading economies
- Africa’s market has over 1B potential customers
TOP 10 eCommerce companies

- 1st Place : Amazon – With global revenues at $108B and a growth rate of 19%, Amazon dominates eCommerce and overwhelmingly cliches 1st place for the Top 10 eCommerce Companies in the World 2018
- 2nd Place : JD.com – Had revenues of $37.9B, and as far as eCommerce growth statistics, it grew at a rate of 40%
- 3rd Place : Alibaba – This company is growing fast. Total revenues equal $22.99B, with an impressive growth rate of 42%
- 4th Place : Walmart – Walmart eCommerce statistics show that global revenues reached $20B with a growth rate of 37%
- 5th Place : Booking Holdings – Revenues came in at $12.68; Growth Rate: 18%
- 6th Place : Shopify – With revenues at $6.73B, and an astonishing growth rate of 73%, Shopify is making it’s mark
- 7th Place : Rakuten – Revenues of $8.77B, and a growth rate of 21%
- 8th Place : Otto – Otto had revenues come in at $8.680B, while the growth rate was 11%
- 9th Place : eBay – eBay had a total revenue of $9.567B, with a growth rate of 7%
- 10th Place : Asos – In 10th place is Asos with revenues of $2.731B, and growth rate: 33%
Mobile eCommerce statistics
- Mobile accounts for 45% of online orders, compared to 61% for desktop
- For 2019 mobile eCommerce is expected to surge, reaching as much as $208.3 billion – 32% higher than 2018
- Mobile eCommerce is projected to make up 39.6% of e-commerce sales
- Mobile is expected to represent 49.25% of total e-commerce sales by 2020
- 2018 saw over 155.5 million mobile buyers, an increase of 5.6% year-on-year
B2B ecommerce statistics
- By end of the year 2017, B2C ecommerce sales hit only $2.3 trillion worldwide, while B2B ecommerce reached $7.7 trillion according to Shopify – this represents a 234.78% difference in market size!
- 84% of B2B global ecommerce sales are made outside of Western continents
- Asia accounts for $6,020 billion of B2B global eCommerce sales, and the rest of the world at $383 billion
- North America and Europe account for 16%, or $988 billion in the US and eCommerce in Europe at $272 billion
eCommerce platform statistics
- WooCommerce lead the pack in 2018 of major eCommerce platforms with 21% of the market share
- In 2018 Shopify came in second in holding market shares, with over 20,000+ eCommerce stores
- Magento came in third place with 15,ooo+ websites
- There are over 350 e-commerce platforms for online retailers to choose from (G2 Crowd)
BONUS: Amazon eCommerce statistics
- Amazon shipped over 5 billion packages in 2017 with Prime alone and now has over 600 brick and mortar locations where customers can return merchandise, in an attempt to reduce the “returns tax”
- In 2018 Amazon generated $258.22 billion in US retail ecommerce sales , an increase of 29.2% from 2017
- nearly 50% of US eCommerce market
- Amazon sales account for 44% of all ecommerce sales in the US in 2017 and demonstrated in 2018 a year-on-year growth rate in the US market of 23%
- 59% of 16-36 year-olds check out Amazon before any other eCommerce site
… and all these without not even 1 single physical store. On the contrary, retail giants like Inditex have 7,292 stores in 93+ markets around the world and generating about $2,5 billion in revenue in 2018.
What it all means for 2021…
These 88 amazing eCommerce Statistics of 2021 are a great starting point for your online retail shop to make a splash with a-rockin’ and informed marketing strategy for your brand this year! You can also have a look to our Retail Statistics of 2021 to get a deeper insight of the emerging trends. So, do you have the tools you need to get started in executing your marketing campaign? Check out ContactPigeon’s innovative platform. We don’t just keep up with the trends, we set them!