Every commercial team eventually meets the same problem in some form. Something works. A product, a campaign, a partnership, a moment of attention nobody engineered, and the traffic arrives faster than the systems built to hold it. Six months later, the traffic is gone, and the only durable record of it is a spike in a chart, because nothing in the stack turned those buyers into people the business could recognise a second time. The Pop Mart marketing strategy is the largest recent example of that problem, and the most instructive, because its customer retention strategy worked in one market and is visibly still being built in the others. In its home market, the company knows who its customers are.
Members generated 93.7% of sales in 2025, and more than half of them bought twice. Overseas, where growth was fastest, that layer did not exist yet when the demand arrived, and the company’s own COO has said plainly what happened next: the customers who came for one character never became customers of the brand. The financial results are the part everyone has seen. The part worth studying is the gap between two capabilities that look identical on a growth chart and behave nothing alike, namely the ability to create demand and the ability to keep the people it brings.
- Pop Mart’s growth is built on owned intellectual property. Proprietary products made up 99.1% of FY2025 revenue, so the company captures nearly all the margin instead of paying licence fees to outside IP holders.
- Repeat purchasing comes from membership, not advertising. Pop Mart’s 72.58 million registered members in mainland China generated 93.7% of FY2025 sales, and 55.7% of them bought more than once.
- Revenue grew 184.7% to RMB 37.12 billion in FY2025 while advertising and marketing spend fell from 4.4% to 3.2% of revenue. This indicates that demand generation happened largely outside paid media.
- Gross margin reached 72.1% in FY2025. The margin profile was supported by owned IP economics, centralised procurement and a rising online share of 44.3% of group revenue.
- Overseas growth outran the identity infrastructure needed to retain new buyers. US sales fell 42% year on year by April 2026, and Pop Mart’s own COO has said that customers who arrived for one character rarely became customers of the brand.
- THE MONSTERS franchise has become a major concentration risk. The franchise, which includes Labubu, grew from 23.3% to 38.1% of total revenue in a single year, leaving the business more concentrated in one IP than at any point in its recent history.
- The blind box mechanic that drives repeat buying is under increasing regulatory attention. China already restricts sales to minors, while Singapore is drafting rules that may require probability disclosure.
- The transferable lesson for retailers is that a demand spike is only worth what the identity layer can capture. Pop Mart proved the model works where membership was built ahead of demand and is still building that infrastructure everywhere else.
Performance timeline of Pop Mart
The window below covers FY2021 to FY2025, with Q1 2026 as a directional update. The reported figures make three dimensions visible: revenue scale, geographic mix, and profitability. Store productivity is shown as a calculated indicator and flagged accordingly.
Chart 1: Revenue of Pop Mart (2021 to 2025)
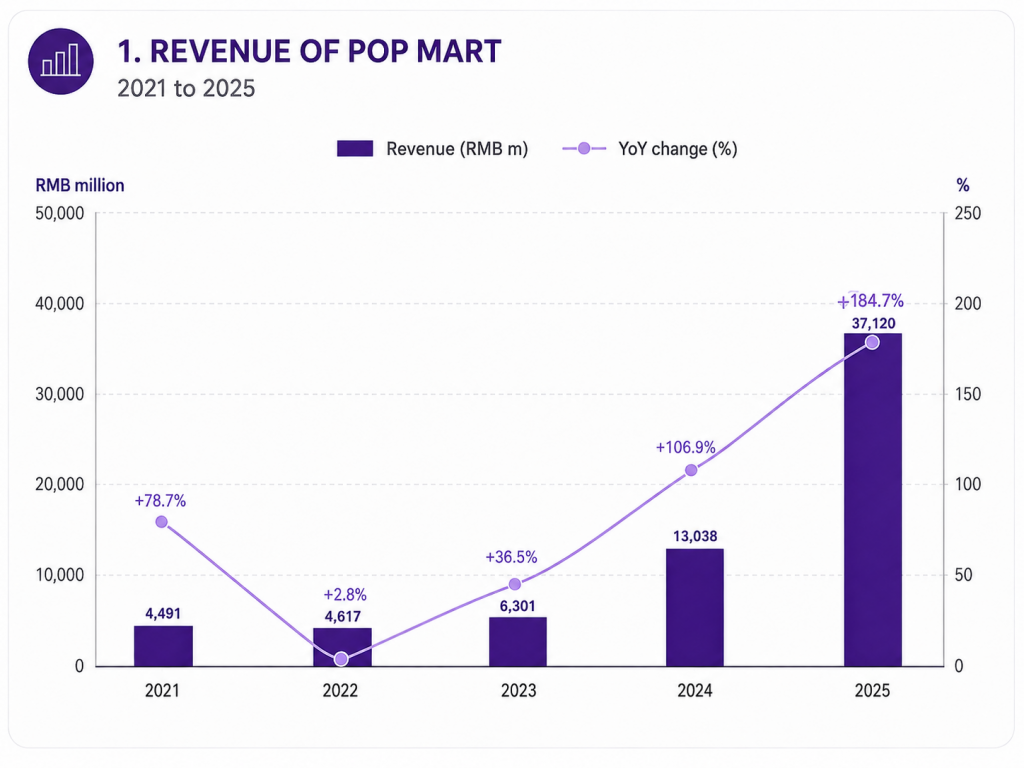
Total reported group revenue, RMB million.
Key inflection points:
- Growth stalled in 2022 at +2.8%, the flattest year on record, before recovering to +36.5% in 2023.
- Revenue expanded 5.9x between 2022 and 2025, with 2024 and 2025 contributing almost all of it.
Why this matters: the company spent a full year at near-zero growth immediately before the phase that defines its current valuation, which tells retail leaders the model is cyclical by construction.
Source: FY2025 annual results announcement; prior-year figures via stockanalysis.com, S&P Global Market Intelligence.
Chart 2: Revenue by region (2024 to 2025)
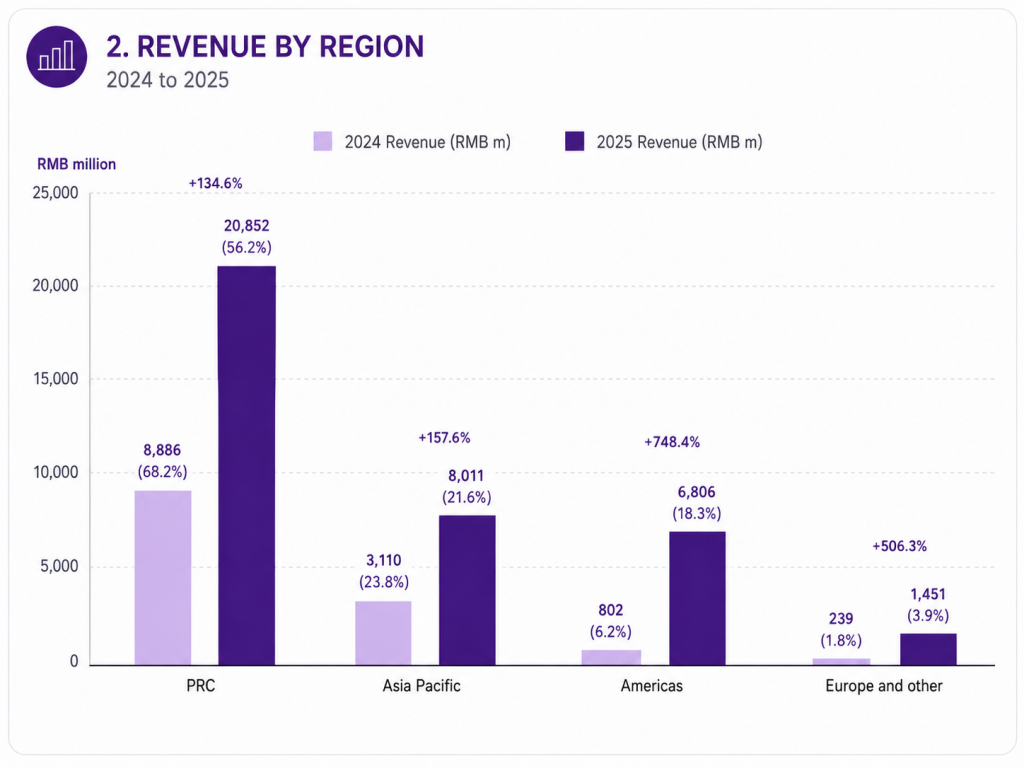
Key inflection points:
- Americas revenue grew 748.4% in a single year and moved from 6.2% to 18.3% of group revenue.
- Overseas operations reached RMB 16.27 billion, or 43.8% of total, from 31.8% a year earlier.
Why this matters: the international mix shift happened in twelve months, which compresses the usual multi-year sequencing of brand building, channel build-out and localisation into one operating cycle.
Source: FY2025 annual results announcement, revenue by regions table.
Chart 3: Channel mix, group level (2024 to 2025)
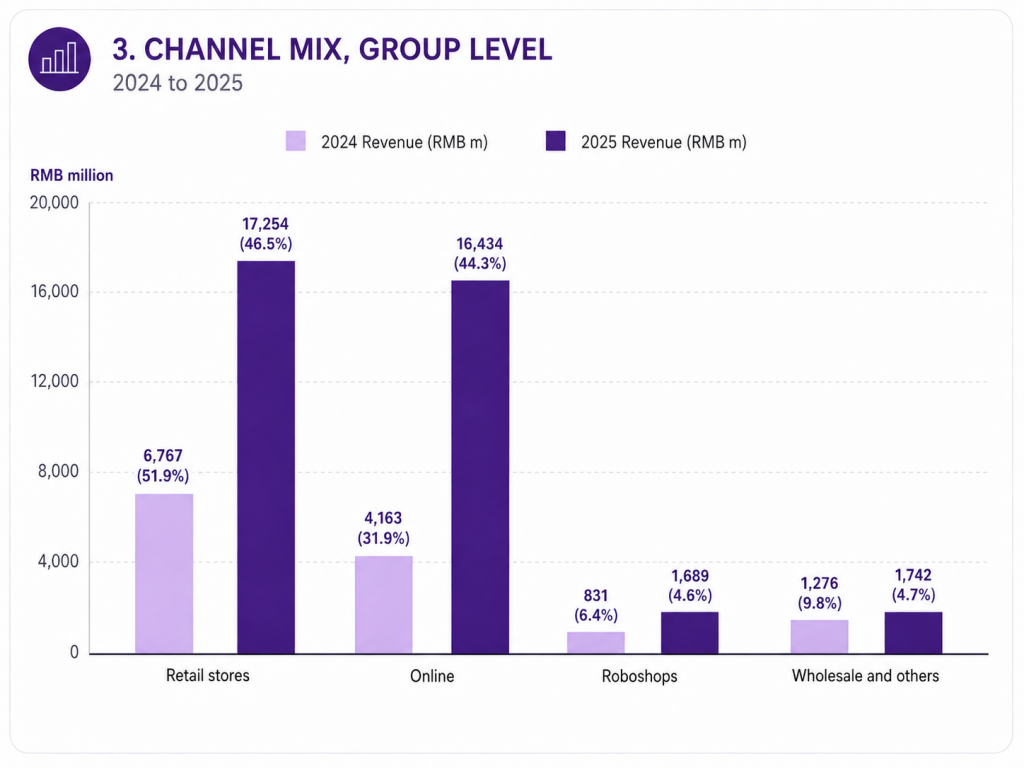
Key inflection points:
- Online rose 12.4 percentage points of mix in one year, reaching 44.3% of group revenue.
- Wholesale halved as a share of revenue, from 9.8% to 4.7%, despite growing in absolute terms.
Why this matters: the company scaled digital and physical simultaneously rather than trading one against the other, and reduced its dependence on third-party wholesale while doing so.
Source: FY2025 annual results announcement, note 4 (revenue by business lines).
Chart 4: Gross margin and operating margin (2023 to 2025)
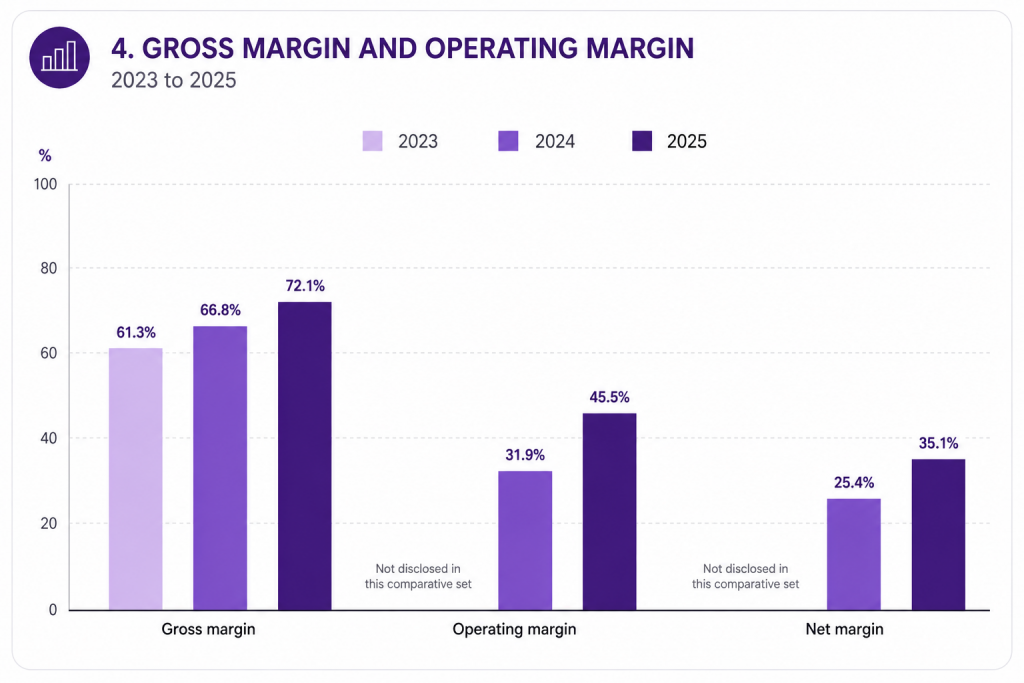
Key inflection points:
- Gross margin expanded 10.8 percentage points across two years, attributed by management to overseas mix and centralised procurement.
- Operating margin rose 13.6 percentage points in 2025 alone.
Why this matters: margin expanded while the store estate and headcount grew, which indicates the cost base is genuinely variable rather than simply under-invested.
Source: FY2025 annual results announcement. Operating and net margins calculated from reported operating profit and profit for the year against reported revenue.
Chart 5: Store and roboshop footprint (2024 to 2025)
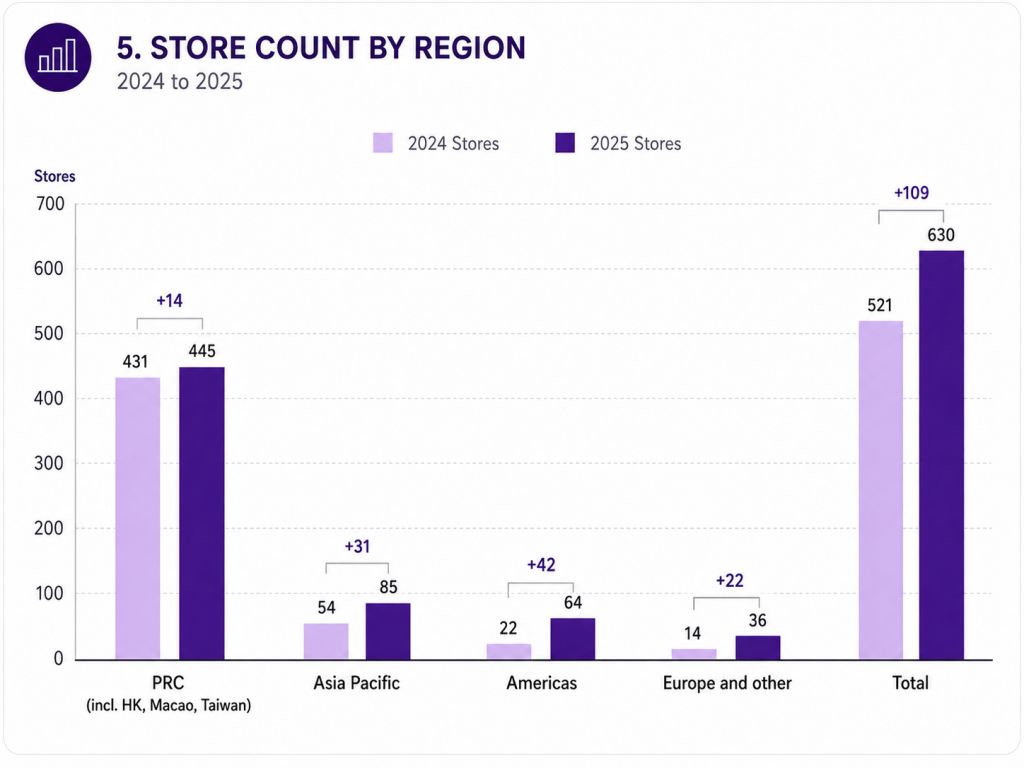
Roboshops rose from 2,472 to 2,637, a net increase of 165.
Key inflection points:
- The Americas estate tripled in twelve months, from 22 to 64 stores.
- The domestic estate grew by only 14 stores, as PRC investment shifted to store upgrades rather than store count.
Why this matters: growth in the mature market came from productivity, and growth in new markets came from footprint, which is a cleaner separation of levers than most retailers achieve.
Source: FY2025 annual results announcement, Consumer Access section.
Limited public disclosure note: revenue per store is not reported. Calculated on the year-end store base, FY2025 retail store revenue per store was approximately RMB 22.6m (PRC), RMB 50.8m (Asia Pacific), RMB 31.3m (Americas) and RMB 23.8m (Europe and other). Because store counts grew substantially during the year, these figures overstate mature-store productivity and should be treated as directional.
Q1 2026 directional update
| Region or channel | YoY growth range |
|---|---|
| Group | +75% to +80% |
| Mainland China | +100% to +105% |
| Mainland China online | +150% to +155% |
| Europe | +60% to +65% |
| Americas | +55% to +60% |
| Asia Pacific | +25% to +30% |
Absolute figures are not disclosed in quarterly business updates. Reported growth ranges for the three months to 31 March 2026:
Key inflection point:
- The regional ranking inverted. The mature domestic market grew fastest and Asia Pacific, the earliest overseas market, grew slowest, reversing the 2025 pattern in a single quarter.
Why this matters: it separates two questions that the 2025 numbers had merged, namely whether the model works and whether it travels.
Source: Q1 2026 business update, 12 May 2026, via Jing Daily and Yicai. H1 2026 results are due 25 August 2026.
Business model decoded: Pop Mart’s retail strategy explained
Pop Mart operates an owned-IP consumer products business that sells almost entirely through channels it controls. The primary economic lever is margin capture on proprietary characters rather than volume on third-party assortment, which is why the Pop Mart marketing strategy behaves more like a licensing business with a store network attached than like a specialty retailer.
Business model snapshot
| Dimension | Pop Mart reality | Evidence/source |
|---|---|---|
| Core value proposition | Character-led collectibles sold through surprise and scarcity mechanics, with plush as the dominant format at 50.4% of revenue. | FY2025 annual results, revenue by product category |
| Assortment model | Proprietary products account for 99.1% of revenue; artist IPs for 90.0%; licensed IPs for 9.1%. | FY2025 annual results, revenue by IPs |
| Primary revenue streams | Retail stores 46.5%, online 44.3%, roboshops 4.6%, wholesale and others 4.7%. | FY2025 annual results, note 4 |
| Margin profile | Gross margin 72.1%; operating margin 45.5%; net margin 35.1%. | FY2025 annual results |
| Cost intensity | Cost of inventories RMB 8.51bn; transportation and logistics RMB 2.04bn; short-term and variable lease expense RMB 1.34bn; licence fees RMB 833.5m. | FY2025 annual results, expenses by nature |
| Manufacturing | Partner-led, with no owned factories; production bases in China and Vietnam, extended to Mexico, Cambodia and Indonesia. | Reuters via Retail Gazette, 2026-01-06; Bloomberg, 2026-01-06 |
| Key constraints | THE MONSTERS accounts for 38.1% of revenue; inventory days extended from 102 to 123. | FY2025 annual results |
Value creation logic
- The purchase is emotional and repeat-by-design. Registered members in the Chinese mainland reached 72.58 million at year-end, contributed 93.7% of sales, and repurchased at a rate of 55.7%.
- Assortment depth sits inside each character rather than across categories. Seven artist IPs each cleared RMB 1.7bn in 2025, and seventeen cleared RMB 100m.
- Format extension carries pricing power. Plush revenue grew 560.6% to RMB 18.71bn and displaced figure toys as the largest category in a single year.
- Value is being extended in time as well as in volume. A live action and CGI Labubu film with Sony Pictures and director Paul King entered development in March 2026, followed by a THE MONSTERS x FIFA World Cup 2026 series, a Labubu x Sanrio collaboration, Uniqlo and Moynat partnerships, and a Starbucks collaboration for MOLLY’s twentieth anniversary across eight Asia Pacific markets from 3 August 2026. Management has stated it is drawing on Disney’s approach to operating IP across decades rather than seasons.
Value capture and economics
- Owned IP means minimal royalty leakage. Licence fees of RMB 833.5m equate to 2.2% of revenue.
- The highest variable costs are physical, not creative: inventories, transportation and logistics of RMB 2.04bn, and commissions and platform charges of RMB 1.44bn.
- Operating leverage is real. Selling and administrative expenses fell from 35.3% of revenue in 2024 to 26.5% in 2025 while sales headcount rose from 5,267 to 8,685.
Scale effects and structural advantages
- Centralised procurement and supplier negotiation were cited by management as direct contributors to gross margin expansion.
- A partner-led manufacturing model allowed capacity to scale without capital intensity. Capital expenditure was RMB 1.17bn against RMB 37.12bn of revenue.
- The balance sheet carries no bank borrowings and RMB 13.78bn of cash, so channel expansion is self-funded.
Structural limits and trade-offs
- Fixed cost exposure is rising. Right-of-use assets grew from RMB 927.6m to RMB 2,791.2m and lease liabilities from RMB 964.6m to RMB 2,861.6m, which converts a flexible cost base into a committed one. That commitment continued through the 2026 slowdown, with a rollout agreed across more than 20 Simon Property Group malls and outlet centres and a 22,000 square foot US headquarters taken in Culver City.
- Input costs have turned. Management guided gross margin down 0.5 to 1.0 percentage points for 2026 on PVC, fabric, packaging and international freight, after five percentage points of expansion in 2025.
- Working capital moved the wrong way. Inventory days extended from 102 to 123, attributed to longer overseas lead times and 109 net new stores.
- Concentration is the binding constraint. One franchise supplies 38.1% of revenue, and management has acknowledged that overseas performance declined materially once traffic tied to that franchise weakened.
- The purchase mechanic itself carries regulatory risk. Blind box sales are already restricted for minors in China, Singapore is drafting rules that may mandate probability disclosure, and Chinese state media has called for tighter oversight on more than one occasion. A constraint on the mechanic would reach the repeat purchase rate before it reached anything else.
Omnichannel architecture: Pop Mart’s online-to-offline marketing strategy
The intent of the Pop Mart marketing strategy is to keep the customer inside owned surfaces at every stage of a drop cycle. The architectural backbone is a self-developed app and official website operating as the identity and transaction layer, with stores, roboshops, and third-party marketplaces feeding into it.
Omnichannel architecture snapshot
| Layer | Pop Mart implementation | Evidence/source |
|---|---|---|
| Sales channels | 630 stores across 20 countries, 2,637 roboshops, a self-developed app, official websites, Tmall, JD.com, Douyin, TikTok, Shopee, Lazada and Amazon. | FY2025 annual results, Consumer Access |
| Owned digital scale | Self-developed app and website revenue reached RMB 2.87bn in the Americas, RMB 1.46bn in Asia Pacific and RMB 315.6m in Europe. | FY2025 annual results, regional channel tables |
| O2O functions | In-store purchase and in-store lottery functions were rolled out globally through the self-developed app. | FY2025 annual results, Online channels |
| Gamified conversion layer | Pop Draw, the online draw-box mini programme, generated RMB 3.42bn in the PRC, up 207.4%, and was extended into the app and website globally. | FY2025 annual results |
| Customer identity | The membership programme reached 72.58 million registered members in the Chinese mainland, with members representing 93.7% of sales. | FY2025 annual results, Member operation |
| Inventory, fulfilment and data latency | Not publicly disclosed. | No public disclosure |
| Key constraints | The overseas membership system is still being built, with management describing global membership as a 2026 priority. | Yicai, 2026-05-13 |
Channel and inventory connectivity
- Physical and digital scaled together rather than sequentially. Online reached 44.3% of group revenue in 2025 while the store estate grew by 109 net units.
- Roboshops function as a low-cost coverage layer rather than a growth channel, at 4.6% of revenue and growing more slowly than every other channel.
- Ship-from-store, BOPIS and store-level stock visibility are not described in public filings, so no claim is made here.
Customer identity and data continuity
- Membership is the layer that makes the domestic business recognisable to itself, turning identity into retail customer intelligence at near-total coverage. A customer who buys without identifying is a rounding error at 93.7% member share of sales.
- Cross-channel recognition is evidenced indirectly. Management reported that members purchasing across more than one channel exceeded one million with triple-digit growth (Longbridge summary of the FY2025 earnings call, 2026-03-26).
- The known gap is geographic. The 72.58 million member figure covers the Chinese mainland only, and management has stated that the domestic multi-IP and membership system will serve as the reference model for overseas markets, which implies it is not yet replicated there.
- Consent is becoming a compliance question and not only a marketing one. China restricts blind box sales to children under eight and requires parental or guardian consent for those aged eight to eighteen, which means age verification sits inside the same account layer that carries marketing permissions. Singapore is drafting rules that may include mandatory probability disclosure and age-based restrictions (Bloomberg, 2026-02-13; SCMP, 2026-02-19). Any market Pop Mart enters now inherits an identity requirement it did not face in China a decade ago.
Order orchestration and fulfilment logic
- Routing logic, channel prioritisation and stock visibility latency are not disclosed. What is observable is release orchestration rather than order orchestration: pre-order systems, staggered regional drops and app-based in-store lotteries used to meter demand against constrained supply.
- Capacity was an explicit constraint during the peak. Monthly production reached a ceiling of roughly 10 million units in 2025 before plush capacity was scaled (Manufacturing Digital, 2026-01-06).
Architectural trade-offs
- Speed against complexity: adding Mexico, Cambodia, and Indonesia to a China and Vietnam production base shortens lead times to Western markets and multiplies quality control and coordination surface.
- Cost against flexibility: the shift of revenue toward owned app and website reduces platform commissions but places the full cost of traffic acquisition and logistics on the brand. Transportation and logistics expenses grew 280.3% against revenue growth of 184.7%.
- Dependency risk: the identity layer that makes the domestic business durable does not yet exist at equivalent depth overseas, which is precisely where the 2025 growth came from.
Analysis of Pop Mart’s growth strategy
Method: Mode B, Observational Executive Review. Every figure below is a disclosed financial line, a disclosed operating metric, or a third-party measurement. Media mix, ROAS, CAC, and incrementality testing are not published by Pop Mart or by any credible third party, so those dimensions are absent from the table rather than estimated.
The Pop Mart marketing strategy is built on demand mechanics inside the product, with paid media used as amplification rather than as the acquisition engine.
| Growth engine | Objective | Disclosed metric | FY2025 signal |
|---|---|---|---|
| Product scarcity and drop cadence | Create demand ahead of supply | Plush revenue | RMB 18.71bn, +560.6%, now 50.4% of revenue. |
| Owned membership | Retain and repeat | Members as share of sales | 93.7% of sales, 55.7% repurchase rate, 26.50m new members. |
| Pop Draw gamified commerce | Convert and extend IP lifecycle | Pop Draw revenue | RMB 3.42bn, +207.4%, largest domestic online channel. |
| Content commerce and livestream | Acquire on third-party platforms | Douyin and TikTok revenue | Douyin RMB 1.59bn, +164.4%; TikTok Americas RMB 1.04bn, +865.9%. |
| Shelf e-commerce | Capture existing intent | Tmall flagship revenue | RMB 1.79bn, +184.4%. |
| Earned celebrity and UGC | Reach and cultural relevance | Advertising and marketing expense | RMB 1.19bn, 3.2% of revenue, down from 4.4%. |
| IP experience and events | Deepen affinity | External IP events | 40 external “Star Friends” events. |
| Licensing and collaboration | Extend IP into new contexts | Licensed IP revenue | RMB 3.38bn, +111.3%, with licence fees at 2.2% of revenue. |
Product scarcity and drop cadence
- Blind box and draw mechanics make the purchase repeatable at a fixed low unit price, with premium formats such as MEGA at RMB 1.92bn providing the top of the ladder.
- Supply was deliberately constrained then expanded. Pre-order systems were introduced in mid-2025 as monthly capacity of roughly 10 million units was reached.
- In short: scarcity is a product decision here, not a campaign decision.
Owned membership as the retention engine
- Registered members in the Chinese mainland rose from 46.08 million to 72.58 million during 2025, and member share of sales climbed from 91.2% at the half-year to 93.7% at year-end.
- Cross-channel purchasing members surpassed one million with triple-digit year-on-year growth, per the FY2025 earnings call.
- In short: the domestic business behaves like a CDP-driven customer loyalty model with a store estate attached.
Pop Draw and gamified conversion
- Management extended the format from a domestic mini programme into the self-developed app and official website globally during the year.
- In short: the mechanic that drives store queues was successfully ported to digital.
Content commerce and livestream
- TikTok represented 15.3% of America’s revenue, and the live unboxing format developed in China was exported globally in partnership with the platform.
- Xiaohongshu GMV grew from a base of roughly RMB 10m to over RMB 100m within ten to eleven months, per the FY2025 earnings call.
- In short: content commerce is the export mechanism, and it moved faster overseas than at home.
Earned celebrity and user-generated content
- The celebrity association that accelerated Labubu was unpaid and unsolicited, beginning with a BLACKPINK member’s social post in April 2024 and cascading through other public figures (McMillanDoolittle, 2025-06).
- THE MONSTERS appeared at the Macy’s Thanksgiving Day Parade in 2025, the first pop toy IP to do so in the event’s history.
- In short: the paid budget stayed small because the product generated its own distribution.
Where the model broke in the Pop Mart marketing strategy
- Bloomberg Second Measure data showed US sales down 45% in March 2026 and 42% in April 2026 year on year (reported 2026-06-10).
- Domestic online sales fell 5% year on year in May 2026 and 14% month on month, per Moojing e-commerce tracking (SCMP, 2026-06-18).
- Management’s own diagnosis is the important part. COO Si De stated that overseas growth was driven by consumers who arrived for one character, lacked familiarity with the wider portfolio, and did not convert into the brand once that character’s traffic faded. He added that an overseas workforce hired at the peak often knew only that character, and that non-Labubu products still accounted for roughly 50% of US revenue in 2025.
- The corrective is a shift of spend from footprint to identity. Wang Ning designated 2026 a maintenance year with growth guidance of no less than 20%, moving emphasis from store count to refined operations and a global membership system. Against that guidance, Morgan Stanley modelled 13%, HSBC 9.6%, and Deutsche Bank a 2% decline as of June 2026.
- In short: acquisition scaled faster than the membership system meant to retain it.
Analysis of the eCommerce strategy of Pop Mart
Method: Mode B, Observational Executive Review. Core Web Vitals, Lighthouse scores, conversion rates, and analytics data are not published by Pop Mart and have not been estimated. The analysis below is drawn from disclosed channel performance and publicly observable site and app behaviour, and is confined to structural findings that hold without instrumentation.
The Pop Mart marketing strategy treats owned digital as the destination for demand created elsewhere, which puts unusual weight on the drop experience rather than on conventional browse and discovery.
| Area | Strength/issue | Why it matters | Evidence | Priority | Owner |
|---|---|---|---|---|---|
| Owned channel share | Self-developed app and website are the largest online channel in the Americas. | Reduces platform commission and captures first-party data. | RMB 2.87bn, 42.2% of Americas revenue, FY2025. | H | Growth |
| Home | Navigation assumes the visitor already knows which character they want. | Serves returning collectors, but filters out newcomers. | Observational, 2026-08. | H | Product |
| Home | The site is organised around release timing rather than category hierarchy. | Matches the way demand actually arrives. | Observational, 2026-08. | M | Product |
| PLP | Sold-out density dominates browsing during peak demand. | Creates wasted sessions at the moment intent is highest. | Observational, 2026-08. | H | Product |
| PDP | Rarity and series are treated as primary product attributes. | Creates the correct information hierarchy for a collectible. | Observational, 2026-08. | M | Content |
| PDP | Cross-sell logic favours the same IP. | Reinforces concentration where the business needs greater breadth. | Observational, 2026-08. | M | Merch |
| Checkout | Queue and lottery systems gate access rather than cart flow. | Fairness perception drives repeat participation more than checkout speed. | Pop Draw and in-store lottery via app, FY2025 disclosure. | H | Product |
Home page analysis
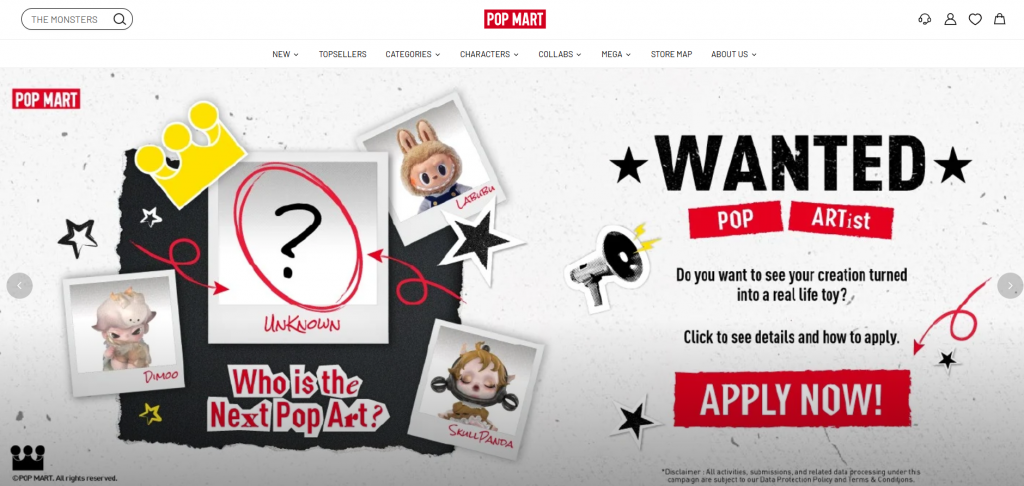
What we liked
- The home page is organised around release timing rather than category hierarchy, which matches a demand pattern where a specific drop, not a category, is the entry intent.
- Regional storefronts are separated by market, supporting differentiated drop calendars and local payment methods.
What we didn’t
- Character-led navigation assumes the visitor already knows the IP they want, which serves returning collectors well and new market entrants poorly. This is the same weakness management identified in its overseas cohort.
- Merchandising depth beyond the current headline release is limited, which constrains cross-IP discovery at exactly the moment the business needs it.
Category pages analysis (PLP)
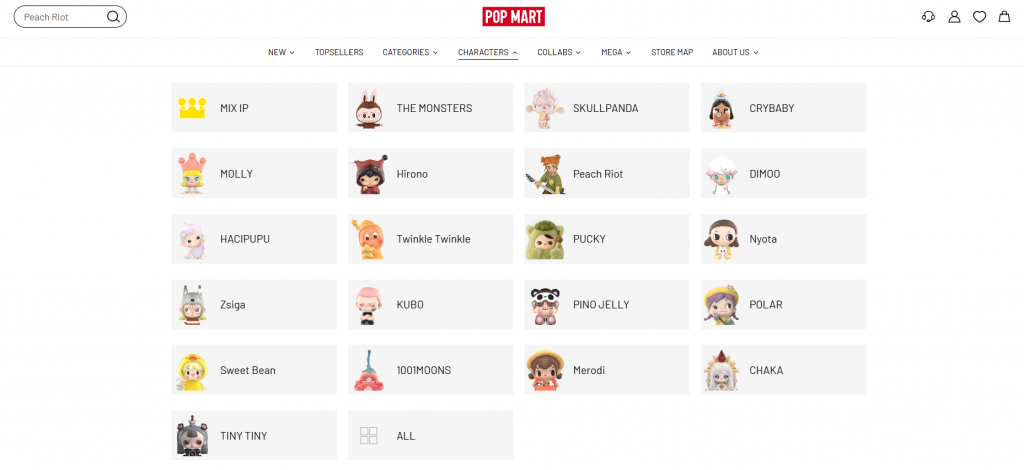
What we liked
- Series-based grouping mirrors how the category is actually collected, so the list page functions as a checklist rather than a filter result.
- Availability status is surfaced at grid level, which reduces wasted clicks during high sell-through periods.
What we didn’t
- Sold-out density degrades the browsing experience during peak demand, with no strong mechanism to redirect that intent toward available inventory in adjacent IPs.
- Faceted navigation is thin relative to the size of the catalogue, which limits long-tail organic capture.
Product pages analysis (PDP)
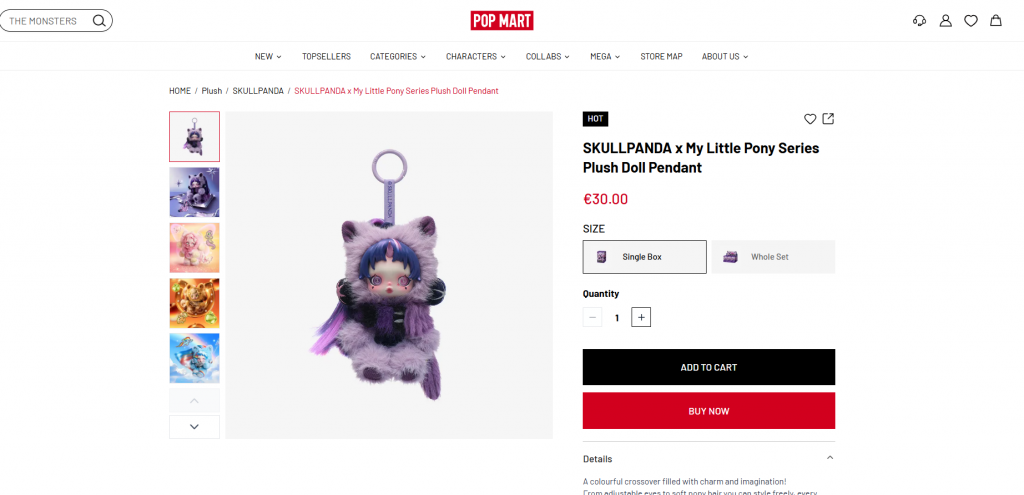
What we liked
- Rarity, series and secret edition probability are treated as primary product attributes, which is the correct information hierarchy for a collectible.
- Blind box mechanics are explained on the page, which manages expectation and reduces post-purchase dissatisfaction.
What we didn’t
- Cross-sell logic favours the same IP, which reinforces concentration at the exact point where the business is trying to broaden its portfolio.
- Restock and back-in-stock signalling is inconsistent, leaving high-intent demand to migrate to resale platforms.
Cart and checkout flow analysis
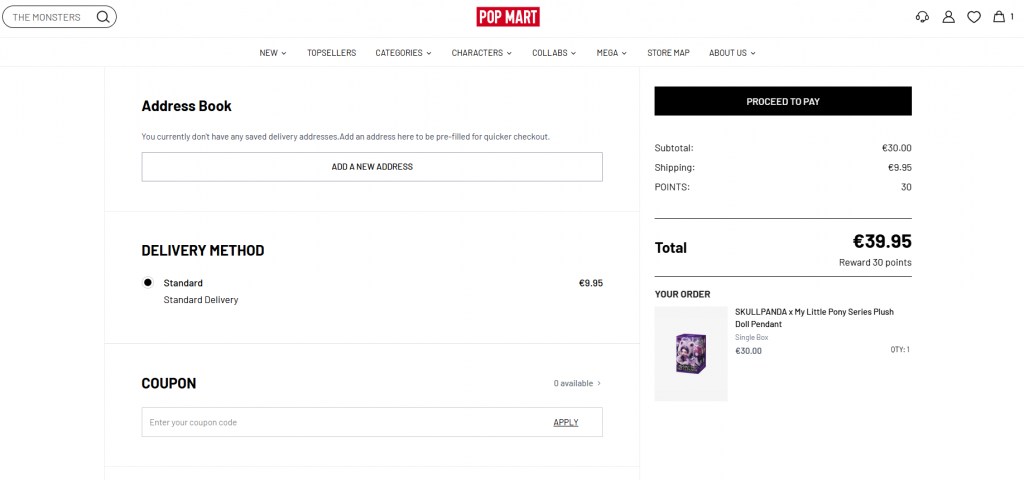
What we liked
- Purchase limits and lottery allocation are enforced before checkout rather than at payment, which protects fairness perception among members.
- Membership identity is carried through the transaction, which is what makes the 93.7% member sales share possible.
What we didn’t
- No quest checkout adds friction that is tolerated by collectors and likely to be abandoned by first-time buyers that need to create an account to proceed.
- International shipping cost and delivery timing visibility vary by market, and logistics expenses grew 280.3% in 2025, so the economics of that variability are material.
Pop Mart marketing strategy resources: Best videos to watch
Curated video gives executives access to how Pop Mart’s own leadership frames the Pop Mart marketing strategy, which differs materially from how the market narrates it.
Video 1: Wang Ning interview with China Central Television
- Platform: YouTube (full video linked via English transcript, Blind Box Daily)
- Speaker: Wang Ning, Founder, Chairman and CEO
- Year: 2025
- Duration: approximately 30 minutes
- Why it matters: Wang states that blind boxes now account for less than 50% of the business and describes the company as an IP company rather than a blind box company, which is the single most useful reframe for anyone benchmarking the model.
Video 2: Inside Pop Mart’s IP Machine, Labubu and Beyond
- Platform: YouTube
- Speaker: Si De, Chief Operating Officer
- Year: 2026
- Why it matters: the COO explains artist selection and IP incubation as a multi-year filtering process, which counters the assumption that Labubu was a lucky campaign.
Video 3: Labubu mania hits a wall, Pop Mart rethinks strategy as resale frenzy fizzles
- Platform: YouTube
- Publisher: CNBC
- Reporter: Elaine Yu
- Year: 2025
- Why it matters: covers the deliberate decision to increase supply and suppress secondary market speculation, a pricing and scarcity trade-off with direct read-across to any brand managing hype inventory.
The most impressive statistics of the Pop Mart marketing strategy
The figures below summarise Pop Mart’s position on the dimensions not already visualised in the performance charts above.
Stat 1: Owned IP dependency
- Metric: 99.1% of revenue from proprietary products
- Period: FY2025
- Context: Almost no revenue depends on third-party licensed characters, which is the structural source of the margin.
- Source: FY2025 annual results announcement
Stat 2: Single-franchise concentration
- Metric: RMB 14,161.1 million, 38.1% of revenue
- Period: FY2025
- Context: THE MONSTERS franchise alone, up from 23.3% of revenue in 2024.
- Source: FY2025 annual results announcement
Stat 3: Category displacement
- Metric: Plush toys 50.4% of revenue, up 560.6%
- Period: FY2025
- Context: Plush overtook figure toys as the largest category within a single year, changing the manufacturing profile of the business.
- Source: FY2025 annual results announcement, revenue by product category
Stat 4: Membership base
- Metric: 72.58 million registered members
- Period: As at 31 December 2025, Chinese mainland
- Context: Members generated 93.7% of sales with a 55.7% repurchase rate.
- Source: FY2025 annual results announcement
Stat 5: Marketing intensity
- Metric: RMB 1,194.4 million advertising and marketing expense, 3.2% of revenue
- Period: FY2025
- Context: Down from 4.4% of revenue in 2024, during a year of 184.7% growth.
- Source: FY2025 annual results announcement, expenses by nature
Stat 6: Working capital
- Metric: 123 inventory turnover days
- Period: As at 31 December 2025
- Context: Extended from 102 days, reflecting longer overseas lead times and 109 net new stores.
- Source: FY2025 annual results announcement
Latest news on Pop Mart
Recent strategic and financial developments, covering the twelve months to August 2026.
News 1: FY2025 results beat on profit, shares fall more than 20%
- Source: Reuters via Global Banking and Finance; CNBC
- Date: 2026-03-25
- What happened: Pop Mart reported revenue of RMB 37.12bn and net profit of RMB 13.01bn, and its shares fell more than 20% on the day, the sharpest single-day decline in nearly a year.
- Why it matters: the market repriced on portfolio concentration and fourth-quarter deceleration rather than on the headline result, alongside a dividend payout ratio cut to 25% from 35%.
News 2: Q1 2026 revenue up 75% to 80%, with 2026 designated a “maintenance year”
- Source: Yicai; Jing Daily
- Date: 2026-05-12
- What happened: mainland China revenue grew 100% to 105% and domestic online 150% to 155%, while Asia Pacific slowed to 25% to 30%. Management guided gross margin down 0.5 to 1.0 percentage points on raw material and freight costs.
- Why it matters: the growth split inverted. The mature market accelerated while the newest markets decelerated, which reverses the assumption underpinning the 2025 expansion case.
News 3: Overseas pullback acknowledged, and forecasts diverge sharply
- Source: Yahoo Finance / GuruFocus; SCMP
- Date: 2026-06-10
- What happened: COO Si De described the post-traffic sales pullback as the largest current challenge for the overseas business, while stating that non-Labubu products accounted for roughly 50% of US revenue in 2025. Company guidance of at least 20% growth now sits against Morgan Stanley at 13%, HSBC at 9.6%, and Deutsche Bank at negative 2%.
- Why it matters: management is separating acquisition capability from retention capability in public, and the width of the analyst spread shows the market has not yet decided which one determines the outcome.
News 4: Blind box sales move toward regulation in a second major market
- Source: Bloomberg; SCMP
- Date: 2026-02-13
- What happened: Singapore’s Ministry of Home Affairs and Gambling Regulatory Authority confirmed they are drafting rules covering blind box and trading card sales, with mandatory probability disclosure among the measures under consideration. China already bars sales to children under eight and requires guardian consent for those aged eight to eighteen.
- Why it matters: the mechanic driving repeat purchase is being reclassified as a gambling-adjacent one. For any retailer running randomised rewards, loot mechanics or mystery formats, age verification and disclosure move from a nice-to-have inside the account layer to a condition of trading.
News 5: IP duration strategy formalised through film and brand partnerships
- Source: CNBC; Starbucks Stories Asia
- Date: 2026-03 to 2026-08
- What happened: a Labubu film with Sony Pictures entered development in March, followed by the FIFA World Cup 2026 series, Sanrio, Uniqlo and Moynat collaborations, POP LAND’s reopened expansion in Beijing, and a Starbucks collaboration for MOLLY’s twentieth anniversary across eight Asia Pacific markets on 3 August.
- Why it matters: the collaboration set moved from collectible adjacency toward daily consumption occasions, and the most recent one is led by a character other than Labubu, which is the diversification the market has been asking to see.
News 6: US footprint expanded through the downturn
- Source: Chain Store Age; LA Times via AOL
- Date: 2026-01 to 2026-08
- What happened: Pop Mart agreed a rollout across more than 20 Simon Property Group malls and outlet centres, took a 22,000 square foot US headquarters in Culver City, and continued opening locations while US sales were declining year on year.
- Why it matters: the company is treating the demand fall as cyclical rather than structural and is committing fixed costs at the bottom of the curve, which is a testable bet rather than a defensive one.
Lessons learned from the Pop Mart marketing strategy
The Pop Mart marketing strategy offers principles that transfer across retail categories, provided they are read as conditions rather than as prescriptions.
Lesson 1: A demand spike is only worth what the identity layer captures
- What Pop Mart did was convert domestic demand into 72.58 million registered members generating 93.7% of sales, demonstrating why a Customer Data Platform or equivalent identity layer matters before demand scales.
- Why it worked in one market and not the other: retention infrastructure was mature at home and immature abroad, and the demand event did not wait for it.
- When this applies: works when membership and identity capture are built ahead of the demand peak. Building them during the peak is already too late.
Lesson 2: Own the demand asset before optimising the channel
- What Pop Mart did: built a portfolio of proprietary characters that accounted for 99.1% of revenue before scaling international retail.
- Why it worked: owning the asset removed royalty leakage and made 72.1% gross margin available to fund channel expansion.
- When this applies: works where a brand can create genuine differentiation at the product level rather than at the assortment or price level.
Lesson 3: The mechanic that drives repeat purchase is the one regulators reach first
- What Pop Mart did: built repeat buying on a randomised reward format that is now restricted for minors in China and under active drafting in Singapore.
- Why it matters: a constraint on the mechanic lands on repeat rate and on the account layer simultaneously, since age verification and disclosure obligations sit inside the same system that carries marketing consent.
- When this applies: applies to any format where the customer pays before knowing what they receive, including randomised rewards, mystery formats and gamified loyalty tiers.
Lesson 4: Scarcity is an operations decision with marketing consequences
- What Pop Mart did: constrained supply during peak demand, then deliberately expanded capacity to suppress secondary market speculation.
- Why it worked: scarcity created urgency, and its removal protected brand perception once speculation began to damage the primary market.
- When this applies: works when a brand can measure the resale market and is willing to sacrifice near-term price for category longevity.
Lesson 5: Portfolio concentration is a growth accelerant and a liability at the same time
- What Pop Mart did: allowed one franchise to grow from 23.3% to 38.1% of revenue during the fastest growth year in company history.
- Why it worked and then did not: concentration compounds returns on a single bet and removes the buffer when that bet normalises.
- When this applies: monitor whenever a single line exceeds roughly a third of revenue, regardless of how well it is performing.
Lesson 6: Acquisition cost falls when the product and the store generate their own distribution
- What Pop Mart did: grew revenue 184.7% while cutting advertising and marketing expense from 4.4% to 3.2% of revenue, with store queues and flagship locations supplying the visibility that budget did not buy.
- Why it worked: unboxing and collecting are content formats by nature, and physical retail gave that content a setting, so customers produced the reach paid media normally purchases.
- When this applies: works only where the product experience carries an inherent narrative and the in-store experience is shareable. It cannot be retrofitted through campaign creative.
Lesson 7: Publish the deceleration before the market finds it
- What Pop Mart did: designated 2026 a maintenance year and named overseas retention as the primary challenge on an earnings call.
- Why it worked: it separated an operating problem from a structural one and gave the market a diagnosis to evaluate.
- When this applies: works when leadership has a specific corrective plan attached, and damages credibility when it does not.
What is the Pop Mart marketing strategy built on?
The Pop Mart marketing strategy rests on owning intellectual property outright rather than licensing it, then converting attention into a membership base that buys repeatedly. Proprietary characters generated 99.1% of FY2025 revenue, and registered members contributed 93.7% of domestic sales, which is why paid advertising stayed at just 3.2% of revenue during a year of 184.7% growth.
Why did Pop Mart’s overseas sales fall in 2026?
US sales dropped 42% year on year by April 2026 because the membership and identity systems that retain buyers in China were not yet built in newer markets. Pop Mart’s COO has said the customers who arrived for one character, most often Labubu, frequently never became customers of the wider brand once that character’s traffic cooled.
How much does Pop Mart spend on advertising and marketing?
Advertising and marketing expenses were RMB 1.19 billion in FY2025, equal to 3.2% of revenue, down from 4.4% the year before. The company relied on unpaid celebrity association, user-generated content and store-driven visibility rather than paid media to sustain its growth.
How concentrated is Pop Mart’s revenue in a single IP?
THE MONSTERS franchise, which contains Labubu, grew from 23.3% of revenue in 2024 to 38.1% in FY2025. That concentration accelerated returns during the growth phase but also left the business more exposed once demand for that character began to normalise.
What is Pop Mart’s outlook for 2026?
Management designated 2026 a maintenance year and guided for growth of at least 20%, shifting focus from store expansion to membership infrastructure. Analyst forecasts vary widely against that guidance, from Morgan Stanley at 13% to Deutsche Bank at a 2% decline, reflecting genuine disagreement over how much of the 2025 growth was durable.
What regulatory risks affect Pop Mart’s blind box model?
Blind box sales are already restricted for children under eight in China, with guardian consent required for those aged eight to eighteen. Singapore is drafting separate rules that may mandate probability disclosure. Because age verification sits inside the same account system that carries marketing consent, any tightening of these rules would affect both compliance and the repeat-purchase mechanic at once.
Key takeaways from the Pop Mart marketing strategy
The pattern behind the Pop Mart marketing strategy and performance is one decision repeated across every function. The company owned the thing that created demand, then removed every intermediary standing between that demand and its own records. Proprietary characters removed royalty leakage. Owned stores and owned digital removed distribution margin. Membership removed the need to buy the same customer twice. The Pop Mart marketing strategy is best read as the consequence of those three choices rather than as their cause.
The verdict on that model is not ambiguous. It works. Domestic margin, repeat rate, and member share all moved in the same direction at once, which is the signature of a business that has actually solved retention rather than one riding a single hit. What the last twelve months exposed is narrower than a crisis of the model: overseas markets were handed the acquisition engine without the identity system built to hold what it brought in, and the traffic did not wait for the system to catch up. That is a sequencing failure, not a design failure, and management has named it in those terms rather than disguising it as a media problem or a competitive one.
For a commercial team, the transferable question is not whether the Pop Mart marketing strategy works. It is whether the account layer, the consent record and the lifecycle programme would already be in place if a comparable spike hit tomorrow, or whether it would need to be built under the same pressure that broke Pop Mart’s overseas retention. That gap between what a business intended to capture and what it actually did is an execution problem, requiring customer identity, channel data and lifecycle messaging to behave as one system across markets that rarely share infrastructure while volumes are moving. It is also the point at which teams typically look for a partner who has closed that gap before.