

An omnichannel marketing strategy is a must in today’s marketplace. But with the volume of marketing channels, business owners need data to make clever decisions. Using a campaign performance dashboard offers valuable insights into each campaign so business owners can leverage that to change their marketing strategy for increased success. With this information, a business owner can allocate resources to their most successful marketing channels and refine their messaging with each new campaign to best resonate with their target audience.
A campaign performance dashboard presents valuable metrics in one location, saving time spent sifting through multiple analytics reports. It is a valuable tool to improve the return on investment of your marketing campaigns and make data-driven marketing decisions.
Table of Contents
- > Quick read FAQ to gain a comprehension of a campaign performance dashboard
- > Constructing an exceptional campaign performance dashboard
- > Examples of campaign performance dashboards that retailers can use as a reference
- > Top-notch tools for impeccable and productive eCommerce reporting
- > The goal is to turn data into information, and information into insight
Quick read FAQ to gain a comprehension of a campaign performance dashboard
This quick guide features an overview of campaign performance dashboards and what a good one should look like.
What is a campaign performance dashboard?
A campaign performance dashboard is a report that includes various metrics for each campaign after its launch. With it, a business owner can determine the campaign’s success and better understand what worked and what didn’t. Like the Camaro performance data and video recorder, a campaign performance dashboard analyzes each campaign and presents real-time metrics to optimize your marketing campaigns.
What is the definition of a performance campaign?
The performance campaign is an advertising campaign in which the business only has to pay when it achieves specific results. This type of advertising lets business owners focus their marketing budget on successful strategies. Platforms such as Google ads and other pay-per-click sites use a performance basis for billing, meaning a business owner would pay more only if the ad campaign generates more clicks.
Why the campaign performance dashboards are vital for businesses in the eCommerce and retail industries?
For an eCommerce business, clicks drive the sales. An eCommerce retailer will not make any profit only unless customers are shopping on their site. A good campaign performance dashboard gives these business owners information to optimize marketing campaigns and drive more business to the website.
Retailers with physical locations can use these insights to build brand awareness and differentiate themselves from a crowded field of competition.
What elements are necessary for a comprehensive campaign performance dashboard?

A well-structured campaign performance dashboard should be simple since it should display each campaign and its results. At a minimum, they should include the following metrics:
- Click through rate
- Sales
- Bounce rate
- Average time on page
- Unique visitors
- Sources of traffic
- Leads
- Conversion Rate
The dashboard should be easy to read with a mix of text and charts for quick interpretation of data.
Is it a necessity for all companies to maintain a campaign performance dashboard?
Marketing is a valuable tool for all businesses aiming to grow and achieve their goals. While a campaign performance dashboard is not necessary, it simplifies the marketing process by offering a detailed overview of each campaign in one location. Business owners can use the dashboard to track campaign performance over time, compare campaign results, and better understand their target audience.
Constructing an exceptional campaign performance dashboard
Use this guide to construct a successful campaign performance dashboard for savvy marketing.
Core components of a 360-degree campaign performance dashboard
A campaign performance dashboard should be well-organized with a comprehensive representation of marketing metrics, such as revenue and sales information, and key performance indicators (KPIs) to be effective.
Component #1: Data that speaks to the right audience
When setting up a campaign performance dashboard, determine who will use it and what they want to see. This tactic will help you ensure that the most valuable metrics are front and center.
Component #2: Data visualization tools
Not everyone wants to read through a lot of text. Data visualization tools make information palatable and easier to grasp in a hurry.
Component #3: Thorough data sources
One of the most valuable benefits of performance dashboards is their ability to track analytics from multiple sources. When setting on a dashboard, choose a tool that integrates with social media analytics, website analytics, and other important data sources.
Component #4: Adaptability
Marketers and business owners will likely track different KPIs based on the campaign. For example, with a social media campaign, they might want to track engagement, shares, and follows. On the other hand, for a PPC campaign, they might want to see click-through rates and leads. Choose a dashboard that offers flexibility to tailor for different platforms.
Component #5: Real-time data
The best campaign performance dashboards update in real-time, allowing a business owner to course correct in the middle of the campaign if needed.
Component #6: Relevant data
A good marketing dashboard offers insights into other aspects of the company, such as financial information, customer service statistics, and other metrics that impact business performance in full.
Essential KPIs and metrics that a campaign performance dashboard should invariably include
A valuable campaign performance dashboard tableau offers multiple metrics to measure your marketing efforts.
Revenue KPIs and metrics

Marketing success translates to revenue, so it is crucial to monitor these metrics:
- Revenue: Vital metric for goal setting and more; Revenue sustains a business and allows it to grow, and more of it allows businesses to set loftier goals.
- Revenue per channel: With this metric, a business owner can see which marketing channels are successfully driving revenue and build their marketing strategy around them.
- Lifetime value (LTV): This is the total value of a customer’s spending over the history of a business. By increasing this metric, a business reduces the costs of acquiring customers.
- eCommerce conversion rate: This is the percentage of total web visitors who made a purchase. It helps marketers strategize on how to move customers from browsing to buying.
- Profit margin: This data helps a business owner determine the financial health of their business.
- Average order value: Refers to how much a customer spends per order. Use it to improve upselling techniques and other methods to increase the number.
- Customer acquisition cost (CaC): How much a business spends to make a sale to a new customer.
- Return on advertising spend (RoaS): This metric allows a business to allocate marketing resources to the channels with the highest return or strategize to improve performance on less successful ones.
Marketing KPIs and Metrics
Tracking each KPI for marketing campaign performance highlights which are effectively generating leads and converting customers. Measure the following to improve your strategies:
a. On-Site Behavioral Metrics
- Total sessions: Measures the total number of visits to a website.
- Total users (unique): Refers to how many people visited the site. This number counts anyone who visited the site multiple times as one unique user.
- Percentage of new users: With this metric, a business will see how many new users visited their website following a marketing campaign.
- Bounce rate: This refers to the number of people who visit a website and leave without interacting.
- Average session duration: Measures how long people spend on the site in a single visit.
- Pages per session: Refers to how many pages a unique user views. For an eCommerce site, this metric can showcase how many people look at multiple products or engage with site content.
b. PPC/Paid Ad Metrics
- Total impressions: This number shows how many people saw the ad.
- Average click-through rate (CTR): This metric refers to the ratio of clicks on your ad to your total impressions.
- Total clicks to the website: With this metric, a business owner can see how many people clicked on the ad and went to their website.
- Total spending: Refers to the total cost for the campaign.
- Cost per conversion: With this metric, a business owner can see how much they had to spend to make one sale.
- Return on ad spend: Refers to the ratio of revenue to the total spent on the ad campaign.
c. Search Engine Optimization (SEO) Metrics
- Total organic clicks: This metric allows a business owner to see how many people clicked on their website through a search engine instead of a paid search campaign.
- Total organic impressions: This number refers to how many times a company’s website appeared in organic search results.
- Average organic click-through rate: With this metric, a business owner can determine how many people are clicking on their site organically instead of through paid campaigns.
- Average organic position: Fewer than 1% of users scroll past the first page of a search, so it’s important to have a high organic search position.
- Sum up table with organic data per category: This is a table with all SEO data in one place for comparison.
- Number of unique backlinks (referring domains): When other sites link to a page, it improves their position in organic searches. Use this metric to view the total number of other websites linking to specific pages.
d. Social Media Metrics
- Total reach: Refers to how many potential unique viewers could see a post or campaign.
- Total engagement: Highlights how many people interacted with a post or a campaign.
- Total clicks to the website: Measures how many people visited a website from a social media post or campaign.
- Total purchases: Refers to how many people purchased after visiting the website.
- Total spending: Measures how much customers, who clicked on a social media post or campaign, spent.
- Average cost per click: Refers to how much a business has to pay to get users to click on their posts and campaigns.
- Stats per social media network: Use this to compare performance across social media platforms.
e. Email/Whatsapp/Viber/SMS Marketing Metrics
- Total sent: Measures the total number of messages sent in a campaign.
- Total opens: Refers to how many people opened your message.
- Total clicks: Measures the total number of people who clicked through to a website from an email or SMS message.
- Average open rate: Refers to the average number of people who opened a message.
- Average click-through rate: Measures how many people click through from email and SMS messages on average.
- Best campaigns by open rate: Use this metric to track which email campaigns are most successful.
- Best campaign by email revenue: Each email subscriber offers value and this metric showcases which campaign drove the most revenue.
f. Referral Marketing Metrics

- Top referrers by revenue: Use this metric to determine which existing customers and affiliates compel people to make purchases.
- Top referrers by traffic: This metric highlights which existing customers or affiliates drive the most traffic to a website.
Supply Chain and Order Delivery KPIs
In eCommerce, order fulfillment and delivery are critical components of successful service delivery. Tracking these metrics helps to improve the customer experience.
- Average delivery time: Measures how long it takes to fulfill an order on average.
- Average cost per parcel: Helps a business owner track and set shipping costs.
- Return rate: Measures how many customers returned packages.
- Average cost per return: Refers to the average expense a business absorbs when a customer makes a return.

Examples of campaign performance dashboards that retailers can use as a reference
These dashboards highlight various types of reporting to include on a dashboard. While they are not specific templates, they can help to create a successful dashboard.
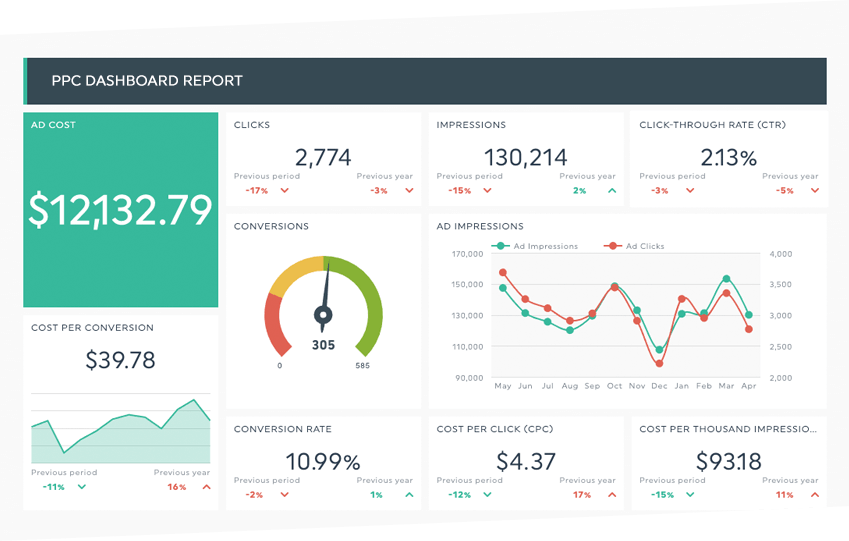
Option 1: A comprehensive “all-in-one” campaign performance dashboard
A comprehensive dashboard is good for campaign manager 360-degree reporting. With it, marketers and business owners get a glimpse of KPIs from every category for a holistic snapshot of marketing efforts.
Pros: This dashboard is splendid for setting marketing strategies, evaluating performance related to marketing goals, and creating new goals for the year to come. It’s also valuable for anyone who wants a 360-degree view of their marketing performance.
Cons: It doesn’t offer the details needed for comparisons.
Option 2: A “decentralized” campaign performance dashboard
This option allows marketers to evaluate campaigns at a more granular level. Every department receives its detailed report and would then be responsible for creating an executive summary report for the Board.
Pros: With this type of dashboard, business owners get more data than they would in an overall dashboard, which helps to measure daily marketing efforts and compare campaigns.
Cons: This dashboard can be tough to navigate with so much information. It is not appropriate for a high-level assessment of a company.
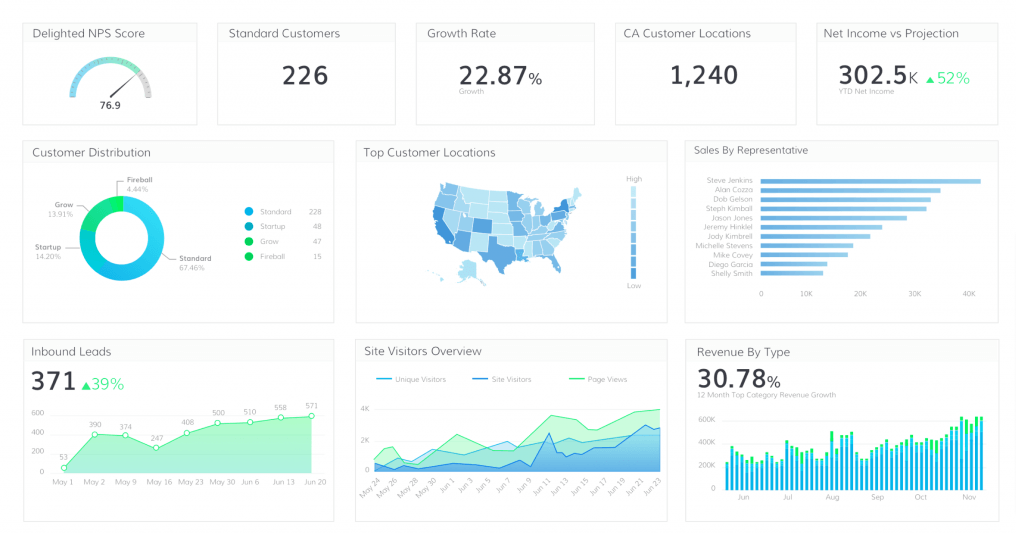
Option 3: A “hybrid” campaign performance dashboard (recommended)
A hybrid campaign performance dashboard refers to a system of dashboards, including a main board with an overview of company information in each category and sub-dashboards that offer in-depth data.
Pros: This type of dashboard offers all the data needed for decision-making.
Cons: If a person isn’t familiar with the dashboard, they may need to spend time finding the data they need.
Top-notch tools for impeccable and productive eCommerce reporting
Instead of trying to reinvent the wheel, use these tools for effective data reporting.
Looker
Looker is a data analytics platform that allows business owners to customize their reports and analyze data. It is a cloud-based platform that offers real-time analytics and data visualization tools. Powered by Google Cloud, this platform integrates with multiple reports, distilling many sources of information into a simple dashboard that is easy to read.
With Looker’s reports, a business owner can track aspects of their customers’ experiences and use the data to improve marketing, service delivery, and more.
ERP and BI Platform
An enterprise resource planning (ERP) and business intelligence (BI) platform is crucial for consolidating information from multiple departments and distributing it to multiple users. Integrated ERP and BI platforms help eliminate data silos so everyone in the company can better understand how their department contributes to overall goals.
These platforms allow business owners to create robust reports, offering comprehensive assessments of their whole business. With this data, each team leader can work together to develop cohesive strategies to benefit the company.
The goal is to turn data into information, and information into insight
Like the Camaro performance data recorder, a good campaign performance dashboard helps a business fire on all cylinders. These dashboards allow data-driven marketing and goal-setting that drive revenue and growth. But do not forget that it is crucial to keep a dashboard simple. Getting hung up on data can slow down strategy execution and inhibit growth. It is better to use insightful metrics without getting caught up in the small details.
To get a handle on your business’s performance with ContactPigeon, all you need to do is contact our growth experts and learn how to turn your data analytics into ROI. We will work with you to gain an understanding of your campaign performance dashboard for retail industry professionals, including audience impressions, clicks, and sales attribution. Having the appropriate data is only half of the equation. Let our team of experts help you leverage the data into increased revenue. We help businesses of all sizes scale their marketing and branding.
Book a free 30-minute retail customer engagement consultation with ContactPigeon’s experts and incorporate an omnichannel strategy that will boost customer engagement and growth for your business.

Let’s Help You Scale Up
Spending time on Linkedin? Follow us and get notified of our thought-leadership content: