


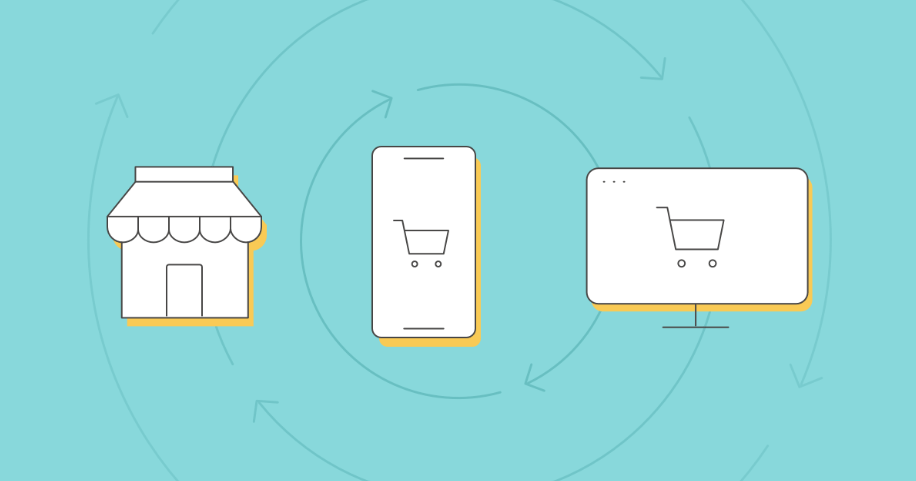
Welcome to the future of retail, where the intersection of technology and consumer behavior has given rise to a new reality that demands adaptability and innovation. In the commerce and eCommerce ecosystem, omnichannel strategies have emerged as a game-changer, reshaping how retailers connect with their customers. In 2024, the significance of omnichannel retailing cannot be overstated, as consumers seamlessly transition between online and offline channels. Thus, the need for a cohesive and integrated approach has never been more pressing. In this blog post, we delve into 55 crucial omnichannel statistics for retailers, exploring the vital role these strategies play in not only surviving but thriving in the competitive market.
As we unravel these statistics, you’ll gain insights into the tangible impact on sales, customer loyalty, and brand perception. Join us on this enlightening journey through the numbers that define the retail landscape in 2024, showcasing why adopting an omnichannel approach is no longer an option but a must-have weapon in your arsenal.
Top omnichannel statistics: Key takeaways
Statistics underscore the growing significance of omnichannel strategies for retailers in meeting and surpassing consumer expectations and skyrocketing sales across diverse channels. Check the figures below to get a grasp of the hottest data-driven takeaways.
- 87% of retailers recognize the critical nature of an omnichannel marketing strategy for their success.
- Marketing campaigns employing an omnichannel approach report a remarkable 494% higher order rate compared to those launched on a single channel.
- Over 50% of shoppers engage with four touchpoints before making a purchase, and the average shopper utilizes nearly six, underscoring the pivotal role of multiple channels for retailers.
- 54% of consumers are inclined to search for a product in-store and purchase online, while 53% prefer to explore a product online and complete the purchase in-store. This trend highlights the profound impact of seamless shopping experiences across channels.
- Global retail e-commerce sales in 2023 were estimated at 5.8 trillion U.S. dollars. Forecasts predict a 39% increase in the coming years, with sales expected to exceed eight trillion dollars by 2027. (Statista)
Omnichannel statistics: How to get the maximum out of them
As executives go through the latest omnichannel retail statistics, they have to seamlessly translate these insights into actionable strategies. Let’s explore how a CFO can turn these insightful figures into tangible initiatives for optimal business impact.
Data-driven decision-making
Use omnichannel statistics as a foundation for data-driven decision-making. Equip your team with insights into customer preferences and behaviors, empowering them to make informed choices that align with the overarching omnichannel strategy.
Invest in technology and infrastructure
Develop a robust omnichannel infrastructure that ensures the availability, usability, integrity, and security of the data across multiple channels. This tactic will help retailers collect and unify valuable data from various sources, such as stores, products, suppliers, and customers, to build a single, coherent, 360º customer profile.
Strategic resource allocation

Leverage statistics on channel effectiveness to allocate resources strategically. Identify high-performing channels and invest resources accordingly to maximize ROI.
Personalized customer engagement
Use data on touchpoints and consumer behavior to create personalized customer engagement strategies. Tailor marketing efforts based on the most frequented channels, enhancing the overall shopping experience.
Optimizing inventory management
Analyze statistics related to in-store and online purchasing preferences to fine-tune omnichannel inventory management. Ensure the right products are available in the correct locations to meet customer demand seamlessly.
Technology integration for seamless experiences
Explore statistics on consumer preferences for in-store and online interactions to guide technology integration. Implement seamless technologies that bridge the gap between physical and digital channels, enhancing the overall shopping journey.
Cross-channel marketing synergy
Identify opportunities for cross-channel marketing based on statistics highlighting consumer behaviors. Develop integrated marketing campaigns that span multiple channels, ensuring a cohesive brand presence and message.
In-store shopping stats
Offline retail sales in the US hit $3.6 trillion in 2022, projected to reach $4.2 trillion by 2028
Despite the surge in digital advancements and the rise of eCommerce, the substantial growth in offline retail sales signals the enduring strength of traditional brick-and-mortar commerce. Contrary to predictions of decline, this resilience showcases continued relevance and the importance of physical retail spaces in the evolving retail landscape. (Forrester)
About 80% of US retail sales still come from physical stores
After the COVID-19 restrictions, brick-and-mortar retail experienced a more robust growth compared to eCommerce. As it turns out, consumers returned to the physical stores post-pandemic, and in-person transactions emphasize the enduring significance of brick-and-mortar stores in retail. (Contimod)
23% of consumers prefer researching online but buying in-store
As we’ve seen, the significance of physical engagement influences customer buying decisions, impacting consumer habits and behavior. It emphasizes that a successful retail store extends beyond mere transactions, highlighting the importance of crafting a holistic and positive in-store experience to effectively drive sales.(eMarketer)
35% of shoppers visit physical stores seeking an enjoyable experience
Deliberately choosing to engage in physical retail, consumers are driven not merely by the need for products but by a desire for a holistic and enjoyable shopping experience. These shoppers prioritize the sensory engagement, personalized interactions, and ambiance that brick-and-mortar stores uniquely offer. (Raydiant)
In 2023, 57% of brands declared that technological investments were a top strategic priority for their customer experience
The intended focus was not only on modernizing operational aspects but, more importantly, on elevating customer engagement and satisfaction. These investments encompassed cutting-edge solutions such as augmented reality displays, interactive kiosks, and personalized mobile applications, with the ultimate goal of creating a technologically enriched and customer-centric environment. (Euromonitor)
BOPIS (buy online, pick up in-store) statistics
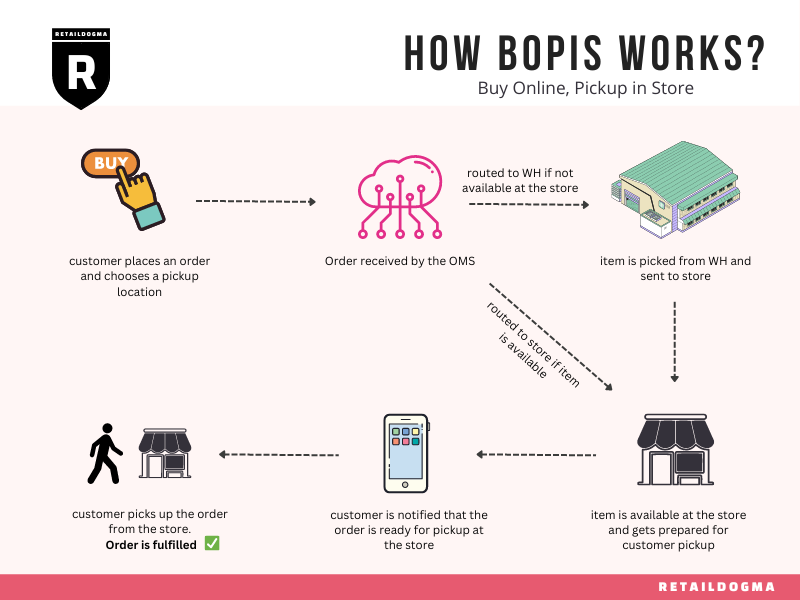
58% of shoppers opt for flexible blended shipping choices, such as BOPIS
This preference reflects a growing demand for flexibility in the fulfillment process as customers seek convenience and control over their shopping experiences. Blended shipping approaches not only cater to varied consumer schedules but also bridge the gap between online and offline channels, aligning with the evolving expectations of the modern shopper. (Shopify)
When customers visit a store for order pickup, 47% of them make additional purchases
Buy Online, Pick Up In-Store (BOPIS), or click-and-collect services boost sales and average order value (AOV). According to the 2022 Global Digital Shopping Playbook, nearly half of those utilizing BOPIS end up making additional purchases during their in-store visit. (Pymnts)
In 2022, consumers in the United States contributed over $95 billion to BOPIS transactions
Constituting 9% of the total eCommerce sales for that year, BOPIS is shaping consumer spending habits. We anticipate the substantial $95+ billion expenditure to rise in the coming years, with projections exceeding $154 billion by 2025. (NoFraud)
Social commerce stats

By 2025, the global social commerce market is projected to reach $2.1 trillion
With a subsequent surge to $2.9 trillion in sales worldwide by 2026, this substantial growth trajectory reflects the escalating influence and economic impact of social commerce worldwide. (Tagshop)
59% of consumers engaging in social commerce express a higher likelihood of purchasing from a small business
Opposed to online shopping through traditional channels, more than half the customers are more inclined to support small businesses, even if they are not familiar with them. (CrewNetwork)
44% of buyers are willing to purchase something from an unknown brand during social commerce shopping
Social commerce strongly influences buyers, compelling them to make purchases that they wouldn’t otherwise. (CrewNetwork)
Excluding China, the UK commands the largest portion, accounting for 35.9% of total sales generated via retail commerce
The size of the global social commerce market is anticipated to experience continuous growth in the coming years. (Goat Agency)
By 2026, the global social commerce market is projected to witness an increase at a faster rate of 35.3%. (Tidio)
More than half of social sellers view audience targeting as a major advantage of social selling
Social sellers can engage with their audience in a more personalized and relevant way, fostering deeper connections, increasing trust, and ultimately driving higher conversion rates and sales. This targeted approach also helps optimize resources by focusing efforts on the most promising leads, improving overall campaign effectiveness. (Hubspot)
60% of Gen Z and 56% of millennial shoppers utilize social media for their holiday shopping
The latest and more tech-savvy generations have embraced social platforms. Especially Gen Z has turned to TikTok not just for entertainment, but also for discovering new brands through their favorite influencers. (Washington Post)

eCommerce omnichannel statistics
- Businesses employing omnichannel customer engagement strategies manage to retain a staggering 89% of their customer base. (Clerk)
- 42% of retail executives allocate up to half of their marketing budget specifically to fuel omnichannel initiatives. (Loyal Guru)
- 70% of consumers seamlessly transition between three or more connected devices. (Go Globe)
- 64% of impulsive online shoppers make purchases at least once a month. (Rubicon)
- Online shoppers are projected to increase to 285 million by 2025. (Optin Monster)
- 5% of consumers express a desire to browse products online while concurrently checking for availability in nearby local stores. (Loyal Guru)
- Companies with better omnichannel customer engagement strategies witness an impressive conversion, with 89% of buyers transformed into loyal and returning customers. (Loyal Guru)
- 62% of consumers start their buying journey with online browsing, highlighting the pivotal role of digital platforms in shaping purchase decisions. (Marketing Charts)
- The lifetime value of omnichannel shoppers surpasses that of single-channel counterparts by a substantial 30%. (Clerk)
- Companies with robust omnichannel customer engagement witness an impressive 9.5% year-over-year surge in annual revenue, significantly outpacing the 3.4% growth observed in weaker omnichannel counterparts. (Clerk)
- Similarly, companies with robust omnichannel strategies experience a 7.5% year-over-year reduction in cost per contact, a stark contrast to the marginal 0.2% year-over-year decrease observed in weaker companies. This highlights the cost-efficiency advantages associated with a well-implemented omnichannel approach. (Porch Group Media)
- Despite the rising demand for omnichannel experiences, only a mere 8% of retailers can consistently provide real-time omnichannel services. (Loyal Guru)
Personalization statistics
- 61% of high-growth companies leverage first-party data to enhance their personalization strategies.
- 60% of consumers express a strong likelihood of becoming repeat customers when exposed to a personalized shopping experience, underscoring the impact of tailored interactions.
- 80% of consumers willingly share their personal data in exchange for exclusive deals or offers, highlighting the value placed on personalized benefits.
- 74% of eCommerce companies have implemented website personalization programs, showcasing the widespread recognition of the importance of tailored online experiences.
- The recommendation engine market is poised to reach a substantial $12 billion by 2025, emphasizing this sector’s significant investment and growth potential.
- Companies integrating effective personalization strategies can potentially generate up to 40% more revenue, showcasing the substantial financial benefits associated with tailoring experiences for customers.
- Personalization has the potential to deliver five to eight times the ROI on marketing spend and lift sales by 10% or more, further emphasizing its pivotal role in marketing strategies.
- A remarkable 90% of consumers find personalization enticing.
- Another 90% of consumers are open to sharing their behavioral data if the associated benefits make their shopping experiences more affordable or easier, highlighting the importance of perceived value in consumer decision-making.
- Personalized CTAs for individuals exhibit a remarkable 202% higher conversion rate compared to non-personalized ones.
- Companies that implement advanced personalization strategies see a $20 return for every $1 invested.
- 81% of customers express a desire for brands to understand when it is a good time to approach them, and when to refrain.
Mobile omnichannel statistics

- 84% of shoppers use their mobile phones to help them shop while physically present inside a store.
- For 71% of shoppers utilizing smartphones for in-store research, this practice has evolved into a crucial and integral aspect of their overall shopping experience.
- One in three shoppers rely on their smartphones to find information rather than asking store employees
- 51% of consumers say that using their phone while shopping saves them time, 44% say that it saves them money
Livestream commerce stats
- In the United States, 44% of livestream viewers make purchases ranging from three to four clothing, shoe, and accessory products per show, emphasizing the commerce potential of livestreaming events.
- More than half of retail companies adopting live streaming strategies prioritize enhancing the shopping experience, recognizing the transformative impact of live interactions on consumer engagement.
Omnichannel vs single channel: Comparative statistics
- On omnichannel platforms, customer purchase frequency skyrockets by 250% compared to single-channel approaches, with an additional boost of 13% in the average order size.
- The difference in customer retention rates is striking, with omnichannel strategies boasting a remarkable 90% higher retention than single-channel approaches.
- 90% of customers anticipate unified and cohesive interactions across various channels.
Omnichannel statistics: Physical stores vs online stores
- 53% percent of consumers return online purchases just as frequently as items bought in-store.
- As of 2023, In the US, consumer spending on online shopping accounted for 63%, compared to 37% for in-store purchases.
- 67% percent of millennials prefer online shopping over in-store shopping, while 72% of seniors favor in-store shopping.
- In the US, 52% of Gen Z prefer shopping online, while 48% prefer shopping in-store.
Discover more insightful resources about industry statistics
- Retail Statistics 2024: The 100 Most Insightful Stats
- Retail Customer Engagement Statistics: 55 Stats
- The 88 Most Amazing Ecommerce Statistics of 2024
- Marketing Automation Statistics for eCommerce [2024]
Discover more omnichannel resources for retailers
- Omnichannel Retail: All You Need to Know for 2024
- 20 Top eCommerce Trends to Watch in 2024
- The 12 Key Omnichannel Retail Trends of 2024
- What Is a Customer Data Platform, and Why Does a Retailer Need One?
Turn these omnichannel statistics into impact
The wealth of omnichannel statistics outlined in this exploration unveils opportunities for retailers to transform these data into impactful strategies. The omnichannel approach is a powerful driver for success in the retail realm. With consumers seamlessly navigating online and offline channels, retailers must harness these statistics to create cohesive, personalized, and immersive experiences. Whether it’s recognizing the influence of in-store interactions, the surge in mobile commerce, or the potential of personalized strategies, retailers can no longer afford to overlook the power of omnichannel initiatives.
The key lies in understanding these statistics and translating them into actionable steps that elevate customer engagement, drive sales, and ultimately position retailers at the forefront of the competitive market. Embracing these insights and turning omnichannel statistics into impact is the transformative journey retailers must embark upon to thrive in the ever-evolving world of modern commerce.

Let’s Help You Scale Up