At ContactPigeon our goal has always been to make data more accessible and insightful.
One question marketers often encounter:
How to define meaningful customer segments and understand key differences among the segments?
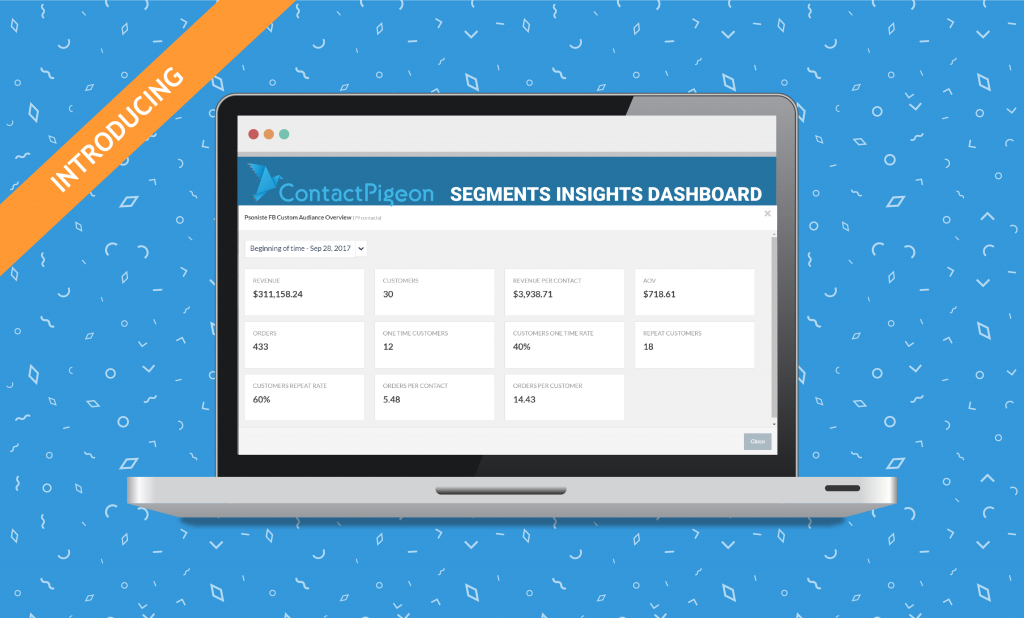
To come up with a solution, we put on our analytics hats and came up with a brand new mini (yet powerful) Ecommerce Insights dashboard.
The new dashboard gives you a quick summary view into key list characteristics and its eCommerce KPIs. Hence, you can quickly understand how a customer segment is performing overall, and how it stacks against another segment.

What’s included in Ecommerce Insights for Segments?
E-commerce metrics at one-glance
Never lose sight of your customer behaviors, revenue results, and conversions. The dashboard gives you a birds-eye view of the list’s key performance metrics on the segment. So you can focus your time on growing repeat customers rather than calculating that repeat rate.
Compare Segment Performance Over Time
Understand how contact volume, revenue, average order value changes over time with the new time period comparison. You can choose the default past 7, 30 or 365 days, or simply define your own custom periods.
Segment Comparison
Is there really a difference between your customers from paid ADs vs. social referrals? Now you can easily find out, by comparing one segmented list with another.
Looking for more guidance?
Here is a quick guide to help you navigate the Ecommerce Insights in our knowledge base.
We hope you find this new dashboard helpful. If you have any metrics or ideas on what we can add next, please give us a shout!
Stay tuned for new features we’re launching over the next few months that will improve the way you reach your web visitors! Be the first to know and subscribe to the blog — you’ll get updates on feature releases, as well as our latest content, right in your inbox.
