

Here at the pigeon nest, we understand that eCommerce managers are always on the lookout for the inside scoop on the latest Valentine’s Day statistics. Look no further! Our pigeons are tweeting songs of love this time of year as Valentine’s Day is fast approaching. In this post, we are spreading the love by sharing our infographic and going over all that you need to know about Valentine’s Day statistics for this romantic holiday!
You might not have realized, but, Valentine’s Day is only seconds behind Black Friday in commercial status. With the increase in popularity of this holiday has come an increase in sales — and these sales are constantly evolving into much more than cards and flowers — as an average of nearly 30% of online purchases were over $100 per customer in 2018. According to recent data from the National Retail Federation (NRF) and Prosper Insights & Analytics, consumers allocated $25.9 billion for Valentine’s Day expenditures in 2023, marking an increase from the $23.9 billion spent in 2022.
Worldwide, eCommerce retailers are gearing up to ask their customers: “Will you be mine?” You need the latest marketing statistics on trends and how to develop a heart-winning email marketing campaign. Let’s take a closer look at the stats so you have everything at your fingertips to make this Valentine’s Day your best ever!
This is why we’ve covered Valentine’s Day Email Marketing thoroughly, writing about Valentine’s email subject lines that work and releasing nicely designed Valentine’s email templates! So, let’s move on!
Table of Contents
- Quick Valentine’s Day FAQ
- Breaking down Valentine’s Day Statistics
- A closer look at demographics
- Mobile, Tablet and Desktop Trends
- Worldwide Valentine’s Day statistics by country
- Top Sellers this Valentine’s Day
- The Valentine’s Day statistics Infographic
- Summing up all the Valentine’s Day statistics
- What do these Valentine’s Day statistics mean for your business
- Make this Valentine’s Day extra special!
Quick Valentine’s Day FAQ:
- What percentage of people celebrate Valentine’s Day?
Based on NRF research, the percentage of people expecting to celebrate Valentine’s Day in the US is ~50%, which is approximately 10% less than the 2009 numbers.
- How much does the average spend on Valentine’s Day?
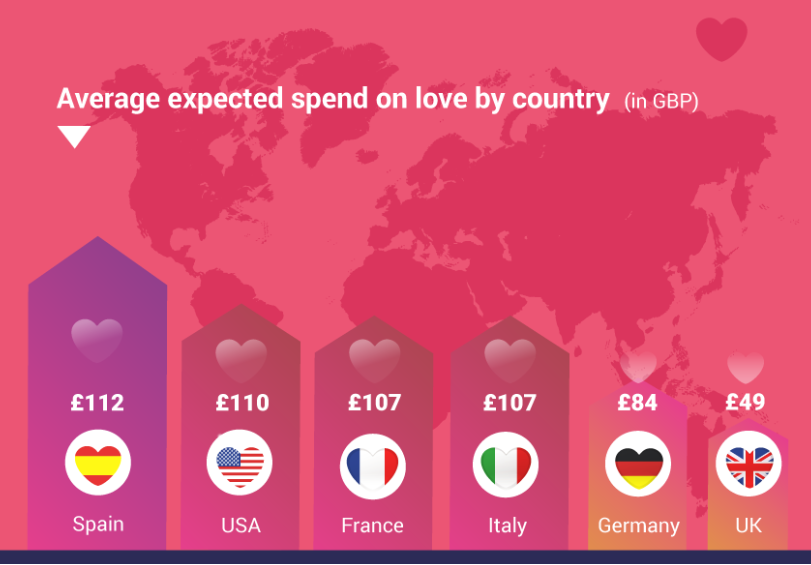
The Spanish consumers seem to be more generous of all topping the average spending with £112 on average for their soul mates. US consumers come 2nd with £110, while French come 3rd with £112 spent in 2018.
- How much money will consumers spend on Valentine’s Day 2024?
We estimate that consumers are projected to allocate nearly $192 for their Valentine’s Day celebrations, reflecting an increase from the $175 spent in 2022. Valentine’s Day 2020 reached $22 billion in the US, based on NRF’s data that fewer consumers are celebrating (vs 2009) but they do spend more on average.
Breaking down Valentine’s Day Statistics
Love really is in the air this time of year — especially for online retailers who are looking to boost their conversions! There has never been a better time to step up your marketing plan to ensure your brand stands out from the crowd.
As a survey by the National Retail Association points out, Valentine’s Day eCommerce sales are booming, with 29% of Valentine’s Day shoppers making purchases online in 2018, an increase from 27% in 2017. Take that into consideration along with the fact that in 2018 the holiday brought in an overall estimated $19.6 billion in total, including purchases made online, in stores, restaurants, or an evening out. That’s compared to an estimated $18.2 billion total spent in 2017.
Now, every savvy marketing manager knows that candy and flowers can’t account for the entirety of the estimated $19.6 billion in sales! So, let’s look at the latest Valentine’s Day buying trends…
Understanding the latest Valentine’s Day buying trends in 2024
Let’s start off with the most up-to-date buying trends. When it comes to consumer buying trends for Valentine’s Day, over the years, there has been a growing increase in personalized gift offering and inclusivity.
Consumer spending intentions for Valentine’s Day indicate a transition towards a more expansive celebration of relationships beyond romantic partners. Consumers are broadening their festivities to encompass friends, co-workers, pets, classmates, and teachers. This inclusive approach to celebrating love and connection presents new opportunities for brands to tailor their marketing strategies to resonate with diverse relationship dynamics.
Moreover, while online platforms remain dominant, the enduring significance of physical stores underscores the importance of seamlessly integrating both realms to provide a unified shopping experience. As shoppers navigate between online and offline channels, the implementation of a well-executed omnichannel strategy becomes imperative for leaving a lasting impact on their Valentine’s Day journey and beyond.
Lastly, a closer look at Valentine’s Day 2024 shows a discernible shift towards more personalized gifting. Some brands, for instance, reported higher sales than in previous years, attributing this to customers favoring custom-designed jewelry over more traditional options.
A closer look at demographics
Understanding your customers is key and the best way to do that is by implementing a plan that segments your mailing list…like a box of Chocolates! For example, did you know that list segmentation helps you build reliable customer personas and a true understanding of your audience resulting in an 8% click-through rate compared to general email blasts at a 3% click-through rate? Online retailers can easily get a head start this Valentine’s Day by segmenting lists according to Web behavior, such as Never Purchased, Frequent Buyers, High-Value Spenders, Price Sensitive (Deal seekers), Recent Purchases, and so on.
Tip: ContactPigeon’s dynamic segmentation tool gives you the cutting-edge in list building features to develop customer profiles and deliver personalized messages in your Valentine’s Day campaigns to different segments.
Combine segmentation with re-engagement campaigns
An added bonus of segmenting your lists is that it lets you develop trigger email campaigns that can ultimately generate 4x more revenue and 18x greater profits! In fact, you might be surprised to learn that 51% of businesses are currently using marketing automation platforms with more than half of B2B companies — 58% to be exact — planning to adopt the technology! Using marketing automation, you move beyond mass emails to a system that allows you to engage your customers by segmenting, retargeting, tracking, analyzing, and making corrections to perfect your marketing strategy.
And, keep in mind that re-engagement emails work like a charm. For Valentine’s Day in specific, eCommerce stores that re-engage their customers see an average increase of 5% conversion rate for online retail shops and up to 23% conversion rate for online travel-related sales.

Are you my Valentine? A look into data on gifting practices
Who is buying Valentine’s Day gifts and for whom? This holiday is no longer only about romance. It’s simply about buying for those you love — including your four-legged furry family members! That’s right! Our pets are more likely to receive a Valentine’s Day gift than a co-worker, with 19.9% of customers spending money on presents going to those cute, lovable furry friends, compared to only 10.3% buying for their co-workers.
This doesn’t mean that romance is dead. Not by any means! In fact, the same data that boasts of increasing sales for pets, shows that about 90% of customers end up spending money on Valentine’s Day on gifts for significant others or spouses.
Who’s spending the most when it comes to gift giving? Unmarried men ages 25–34, according to a composite of studies. In fact, not only are men the bigger spenders when it comes to this, the most romantic holiday of the year, but they also do the most gift-giving, with 62% of men expecting to buy a gift for a loved one in 2020, versus only 45% of women.
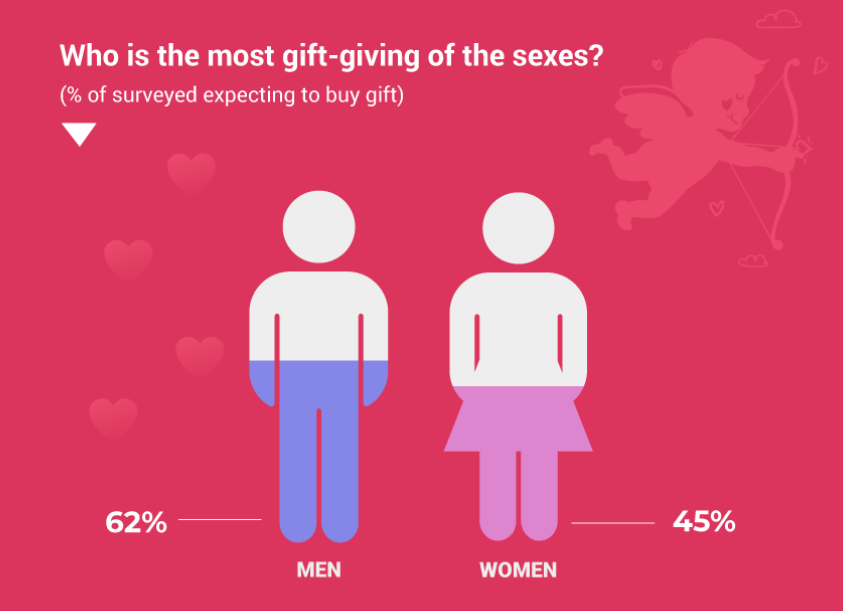
Valentine’s Day Statistics – Gender Comparison

Top 10 Valentine’s Day statistics for 2024
- In 2023, 32% of consumers intended to present the gift of an experience, marking an increase from the 26% reported in the previous year.
- Approximately 52% of individuals partake in Valentine’s Day celebrations.
- Nearly 30% of Americans are anticipated to go under with credit card debt due to their Valentine’s Day expenditures.
- A total of 35% of consumers plan to make their gift purchases online.
- Approximately 224 million roses are cultivated specifically for Valentine’s Day.
- An estimated 6 billion individuals choose Valentine’s Day as the occasion to get engaged.
- The highest spending patterns are observed in younger millennials and Generation X, with respective planned expenditures of $266 and $268.
- 36.55% of shoppers opted for Amazon when selecting their V-day gifts.
- 46.97% are going to brick-and-mortar stores and other online retailers.
- A total of 16.48% of shoppers are creating their Valentine’s gift themselves through a do-it-yourself (DIY) approach.
Mobile, Tablet and Desktop Trends
It’s a fact: mobile is growing. This means to be ready for Valentine’s Day sales, you need a responsive campaign for your customer’s journey across all devices. In Q3 2018, smartphones accounted for 61% of retail site visits worldwide and generated about 45% of online shopping orders. Also, Mobile commerce hit $700 billion in revenue in 2017 — that’s an increase of 300% growth over the past four years, and it getting bigger and bigger every year. In fact, when it comes to Valentine’s Day trends, in 2018, over 22% of consumers opted to make Valentine’s Day purchase on their mobile devices. In 2021, BigCommerce predicted 54% of total eCommerce will be generated by M-Commerce total eCommerce transactions, so we expect the same trend to affect Valentine’s Day transactions as well.
Wait, we have more on the evolving eCommerce trends of Valentine’s Day!
That’s right…we are just getting started! Did you know that in 2018, almost 50% of Valentine’s Day shoppers said that they would shop early for gifts and complete their purchases during the first 2 weeks of February? This means that eCommerce marketing managers need to roll out Valentine’s Day marketing strategies early since shoppers start bookmarking and making a gift list as much as a month in advance!
Planning and scheduling your email campaign way in advance has many benefits. First off, you’ll be first and foremost on the minds of buyers looking to get some early gift perspectives. Also, the earlier you start promoting your sales, the more visibility and sales opportunities you’ll have. Lastly, you can help your customers avoid messing up their Valentine’s Day gift-giving by offering early delivery ahead of the big day!
Tip: And, don’t forget to offer a little gift to your visitors, too! After all, it’s Valentine’s Day! Your customers are more likely to click through to purchase on your site. In fact, 91% of Americans want to receive promotional emails, so send them sales and deals and promote your brand
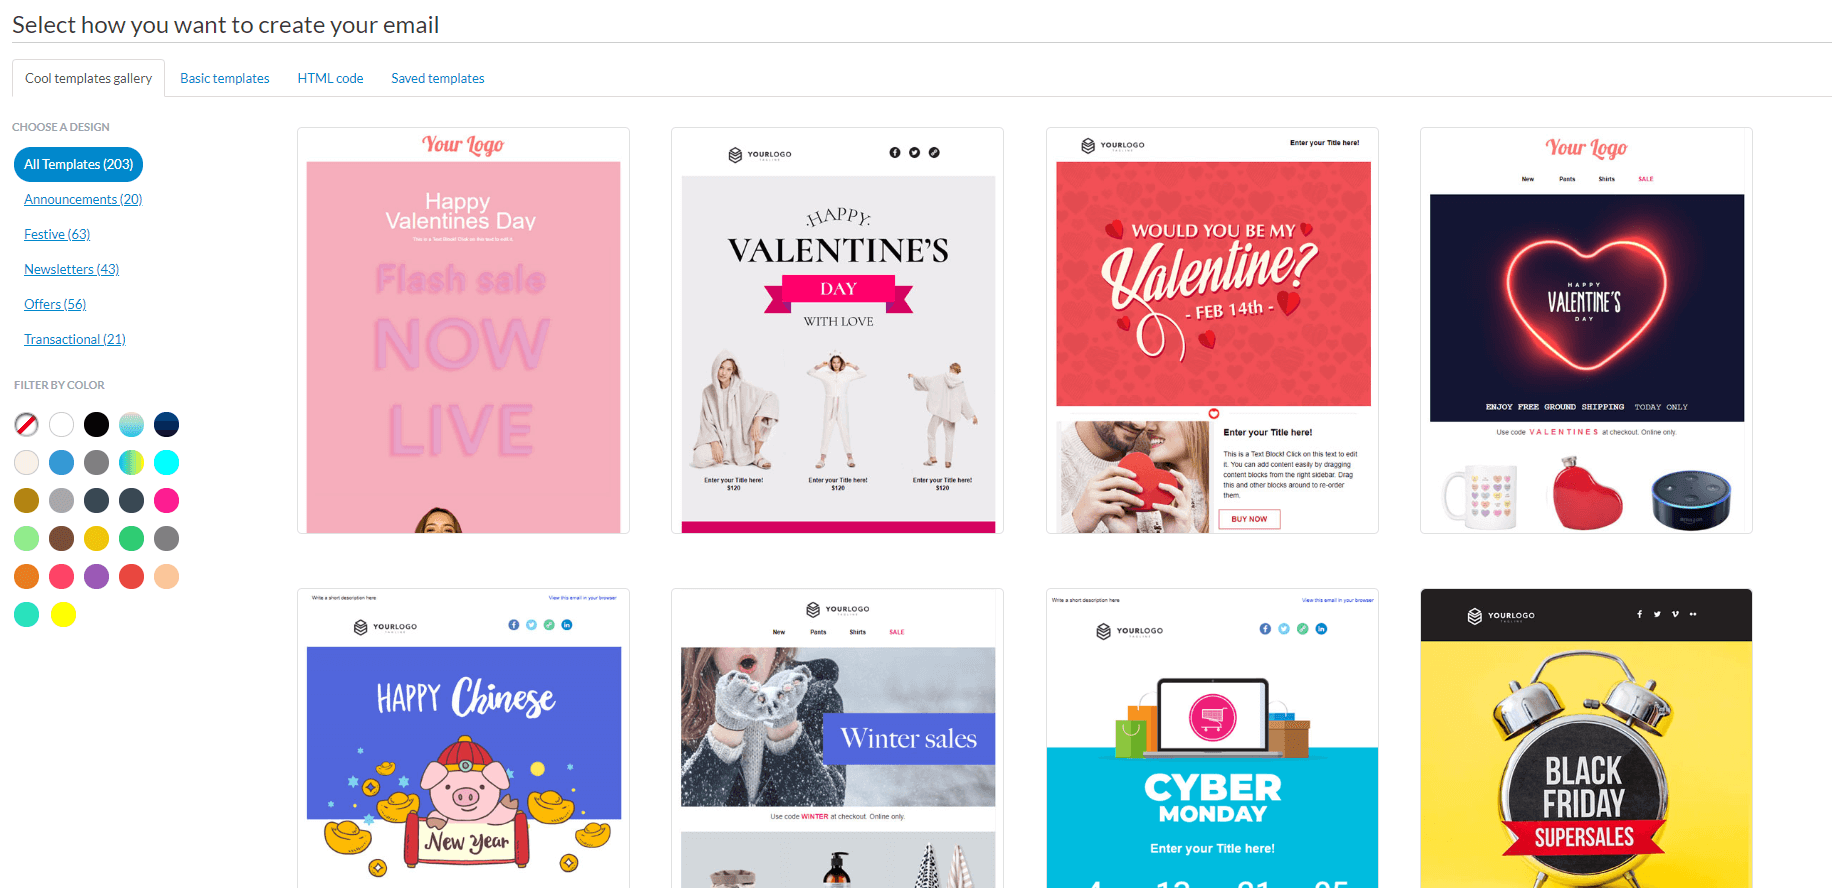
Selection of Valentine’s Day email campaign templates from ContactPigeon.
Worldwide Valentine’s Day statistics by country
Now, it’s time to take a look at which countries have been struck by cupid’s arrow! We’ll fill you in on who is buying what and which trends individual countries and regions are setting for Valentine’s Day.
USA
A total of 135 million people in the USA were expected to shop for Valentine’s Day in 2019, that’s over half — 53% — of all Americans! And the amount they are expected to spend is just as staggering, totally about $30 billion. In 2020, the total spending on this lovable day surpassed 27 billion US dollars.
Also, consumers in the USA are spending BIG this holiday, as they are projected to spend an average of $221.34 on gifts. Where are online consumers buying? A whopping 74% of American respondents to a National Retail Federation survey said that they planned to buy Valentine’s Day gifts on Amazon.com in 2018. This shouldn’t be surprising when you consider who is doing most of the gift buying…Some 63% of Millennials, are planning to buy gifts for their loved ones this Valentine’s Day! Gen X closely follows at 57%, and lastly, only about 39% of baby boomers plan on buying a gift.
What about Valentine’s Day sales conversion rates for the USA market? They skyrocket during the final days leading up to the holiday, with a boost of 164% higher than usual, with the daily sales rates returning to normal the very next day. After all, no one is going to score any Brownie points with a late Valentine’s Day gift!
Some additional USA statistics for 2024 include:
- In 2022, expenditures surged to $23.8 billion following the lif of the strict Covid-19 health measures.
- The top gift preference stands at 56% for candy, followed by greeting cards at 40% and flowers at 37%.
- Jewelry, a widely favored choice, witnessed a significant expenditure of $4.1 billion in 2021.
- In the case of millennials aged 23-29, the average spending on a significant other amounts to $266.
- Older millennials exhibit comparatively lower expenditures, with an average of $109.
- 11% of consumers can’t make up their minds on what to buy
UK
It would appear that consumers in the UK have been hit by Cupid, as one unique trend this demographic demonstrates an estimated spending of £2.1 billion in 2024. Not only are Brits searching for the perfect gift, but they are also more spending money on their loved ones as well these days, with the number of transactions going up by 23% during Valentine’s Day period over the last few years.
What are they buying in the UK? This shift from buying material goods means that UK consumers are giving more personalized gifts, such as planning romantic Valentine’s Day getaways — by air and train. In fact, spending in this sector increased by 31% in 2017, accounting for 19% of total spending, while hotel stays represented 38% of spending.
Another trend that the Brits are setting is spending online. That’s right, online shopping continues to grow at a mind-blowing pace as the number of e-commerce transactions from Valentine’s Day 2015 to Valentine’s Day 2017 grew 169%.
Additional interesting UK Valentine’s Day statistics to take into account in 2024:
- Many intend to keep a budget-friendly approach, with the majority (68%) planning to spend between £1-£50, while 16% have intentions of exceeding that amount.
- In 2023, a third of Britons (33%) celebrated Valentine’s Day with a romantic interest, marking an increase from the 23% in 2022.
- The majority of UK consumers (55%) do not plan to celebrate at all, while a small percentage (7%) express their intention to mark the day either alone or with family and friends.
- 62% of British customers express their intent to “spend time together at home,” while 24% plan to enjoy movies or TV.
- For a more public display of affection, a quarter (24%) will go for a meal or drinks, and an additional 4% plan to attend an event or activity.
- The minority (4%) has intentions to travel for the occasion.
- The preferred gift is a greeting card, chosen by 41% of celebrants, followed by chocolates/sweets (20%) and flowers (18%).
- A notable 22% of Britons resist the commercialization of love by not succumbing to give any gifts.
- Men are eight times more likely (33% vs. 4%) to give flowers and seven times more likely to present a restaurant voucher (7% vs. 1%).
- Conversely, women are more inclined to avoid giving gifts altogether (28% vs. 18%).
Valentine’s Day Statistics By Country
Europe
Europeans have also caught the Valentine’s Day fever and go all in when it comes to gift giving. In fact, on February 12, 2018, just two days before Valentine’s Day, across Europe there was an influx of 7x more flowers sold, while there were 400% more flowers than usual ordered on Valentine’s Day, 2018. Yes, everyone loves flowers!
Ecommerce marketers also need to pay attention to the growth of mobile across Europe, as on the weekend proceeding Valentine’s Day, orders made on mobile devices increased from 25% in 2017 to up to 47% in 2018. This is just one more reason to be sure that you have a rockin’ marketing campaign that every visitor to your site can enjoy effortlessly, across devices. Particularly because on Valentine’s Day half of all purchases are made on mobile devices, and, in the days leading up to the event, conversion rates jumped 187% higher than usual in Europe.
More European Valentine’s Day statistics to take a look at:
- In Spain, over a third of individuals (38%) plan to celebrate the day of lovers.
- Spanish men will spend around 171 euros and women 77 euros.
- France follows closely in second place with 35%, though the uncertainty about celebrating Valentine’s Day has risen to 26%, compared to last year’s 21%.
- The statistics for other countries are as follows: Italy (32%) and Germany (18%).
- 44% of Italians exhibit indifference towards this holiday.
- 63% of French consumers intend to purchase a gift for the occasion.
- Men in France plan to spend approximately 125 euros, while women aim for an expenditure of around 86 euros.
- In Italy, 74% of consumers express their intention to shop for Valentine’s Day.
- Men in Italy planning to spend around 141 euros and women around 82 euros.
- 71% of Spanish consumers will make purchases to celebrate Valentine’s Day.
Top Sellers this Valentine’s Day
This brings us to the top sellers for Valentine’s Day 2019, and topping the list is candy, with 55% of shoppers saying they will give the gift of sugar to their loved ones. The list goes on with the typically expected gifts, such as, saying “I love you” with greeting cards, which 46% of Valentine’s shoppers plan to do. While 36% will buy flowers, and maybe combine it with a night out on the town as 35% of shoppers are gifting a date. Of course, 19% of shoppers are buying jewelry, as Valentine’s Day without jewelry is unheard of! And 17% of shoppers plan to gift clothing this year. For those who don’t know what to get their loved ones, there are always gift cards — and some 15% of shoppers are planning to give them as gifts.
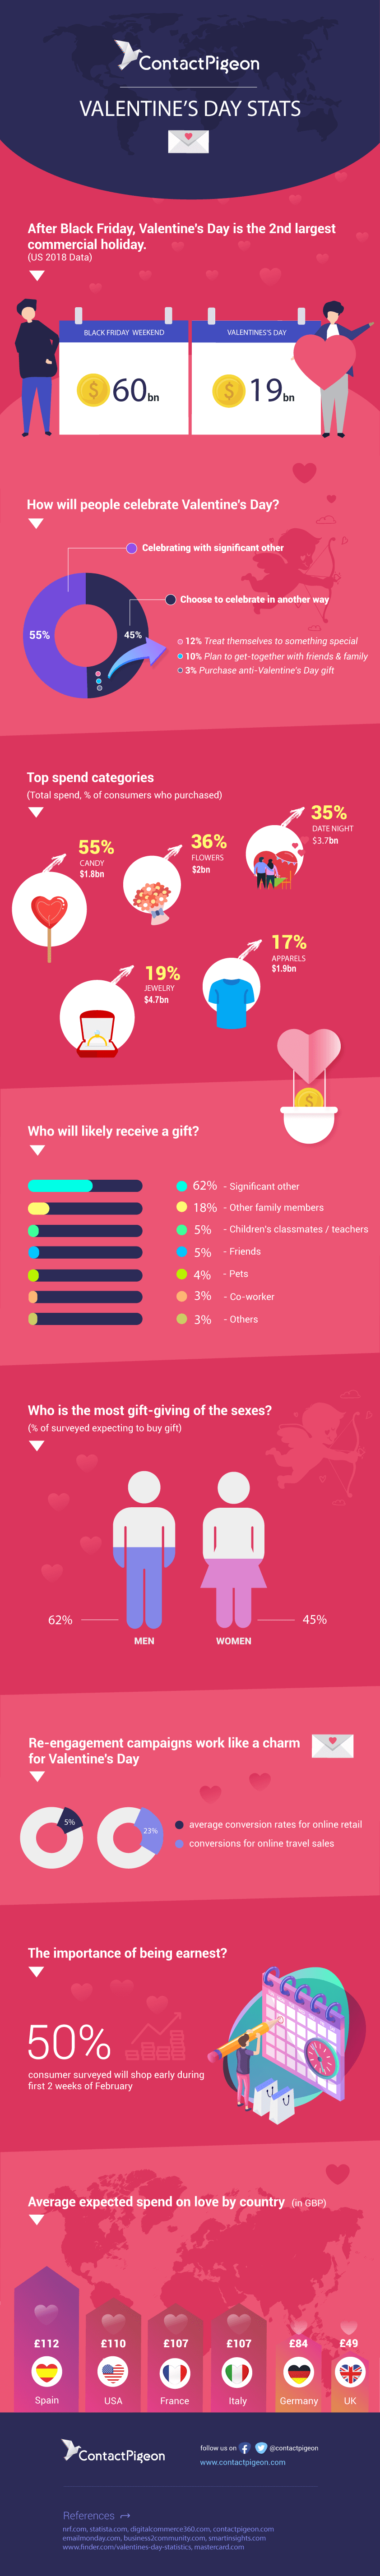
The Valentine’s Day statistics Infographic
Note: Keep in mind that this infographic was created based on 2019 data. It is quite useful for comparison insights.
We summed up all of the above-mentioned Valentine’s Day statistics and designed an infographic to quickly take a brief picture of the most special day of February:
Share this Infograph

Let’s Help You Scale Up
More interesting Valentine’s Day statistics
- 46% of consumers state that they will be celebrating Valentine’s Day at home or that they will be limiting time in public because of COVID-19 outbreak. (Statista)
- 15% of consumers are saying that they will be shopping online more for gifts this year. (Statista)
- 17% of people will be spending less on gifts due to financial hardship. (Statista)
- In 2021, $21.8 Billion were spent in total on Valentine’s related purchases. (WalletHub)
- This means that every individual spent $164.76 to celebrate this special day. (WalletHub)
- Women spent on average $101 in comparison with men that spent more than double ($231) for Valentine’s Day. (WalletHub)
- It is predicted that in America, 2 billion will be spent on flowers, another 2 billion will be spent on candy and 4.1 billion will be spent on jewellery. This means that in total 8,1 billion dollars will be spent on Valentine’s shopping. (WalletHub)
- From February 1st until February 14th, online dating in America rises by 33%. (WalletHub)
- 28% of shoppers will buy gifts from discount stores. (WalletHub)
- 41% of people will celebrate by having a special dinner at home. (WalletHub)
- 30% of annual flower sales take place on Valentine’s Day. (WalletHub)
- 53% of women stated that they would break up their relationship in case their significant other won’t get them anything on Valentine’s Day. (WalletHub)
- In the US, 15% buy themselves a gift for Valentine’s Day. (WalletHub)
- In the US, 1.3 billion dollars are spent on Valentine’s gifts for pets. (WalletHub)
- Experts predict that 2.1 billion will be spent on Valentine’s gift cards. (WalletHub)
- The age group 35-44 spends the most money on Valentine’s gifts ($264). (BalancingEverything)
- From 2020 to 2021, the spendings for Valentine’s day were reduced by 16.07%. (BalancingEverything)
Summing up all the Valentine’s Day statistics
We’ve gathered all the valentine’s day retail statistics from the countries that do celebrate this very special (& lovely) day:
Statistics by Country:
- Valentine’s Day statistics US: $25.9 billion (2024 update)
- Valentine’s Day statistics UK: £1.4 billion (Based on the 6 top-selling categories)
- Valentine’s Day statistics Australia: $0.5 billion Australian dollars (source)
Top-selling categories (based on popularity):
- Candy: 55% (1.8 billion spent)
- Flowers: 36% (2 billion spent)
- Dining: 35% (3.7 billion spent)
- Jewelry: 19% (4.7 billion spent – top in terms of revenue generated)
- Apparels: 17% (1.9 billion spent)
Least favorite categories:
- 8% opting for clothing items and perfumes/cologne
- 7% selecting lingerie or pajamas
- 5% choosing a romantic holiday
- 4% opting for cosmetics/beauty products
Statistics by Lover:
- Valentine’s Day spending per lover (on average, in GBP):
- Spanish consumer: £112
- US consumer: £110
- French consumer: £107
- Italian consumer: £107
- German consumer: £84
- British consumer: £4
- Who will be the gift receiver:
- Significant other: 62%
- Other family members: 18%
- Children’s classmates/teachers: 5%
- Friends: 5%
- Pets: 4%
- Co-worker: 3%
- Others: 3%
- How will people celebrate Valentine’s Day:
- With significant other: 55%
- In a different way:
- 12%: Treat themselves to something special
- 10% Get together with friends & family
- 3% Buy anti-Valentine’s Day gift
- Who is the most gift-giving gender
- Men: 62%
- Women: 45%
What do these Valentine’s Day statistics mean for your business
Now that you have a brief picture of the latest Valentine’s The key takeaways that can affect directly your business goals and numbers are:
- You should definitely run a Valentine’s marketing campaign
- You should definitely run an anti-Valentine’s marketing campaign
- Prepare early: The majority buys gifts 2 weeks prior so you need to launch your marketing campaign 3-4 weeks prior to 14th February!
- Segmentation is absolutely necessary since you have to make separate campaigns for each gender
- If you sell products for pets, do promote them
- Triggered email campaigns can ultimately generate 4x more revenue and 18x greater profits than ordinary email marketing campaigns.
- EXTRA TIP: Since omnichannel marketing can help a brand achieve 91% greater YoY customer retention (source: Aspect), invest early to get a headstart vs your competitors this Valentine’s. Especially in terms of remarketing and re-engagement campaigns, the conversions reached 5% in retail and up to 23% in the travel industry!
Other insightful Valentine’s Day marketing resources for a retailer
- The 21 Best Valentine’s Day Campaigns the World Has Ever Seen
- 10 Lovely Valentine’s Day Promotion Ideas for Retail
- 60+ Romantic Valentine’s Day Email Subject Lines to Steal
- 7 Super Lovable Valentine’s Day Email Marketing Ideas
Make this Valentine’s Day extra special!
Valentine’s Day is increasing in popularity each upcoming year and this means that businesses are becoming more competitive than ever to win the hearts and wallets of their customers. This means it requires a bit of advance planning and preparation to plan a fruitful Valentine’s Day campaign that distinguishes your brand. By using some of these Valentine’s Day statistics into your Valentine’s Day marketing strategy, you can ensure that your brand will win the hearts of your customers.
Let’s Help You Scale Up