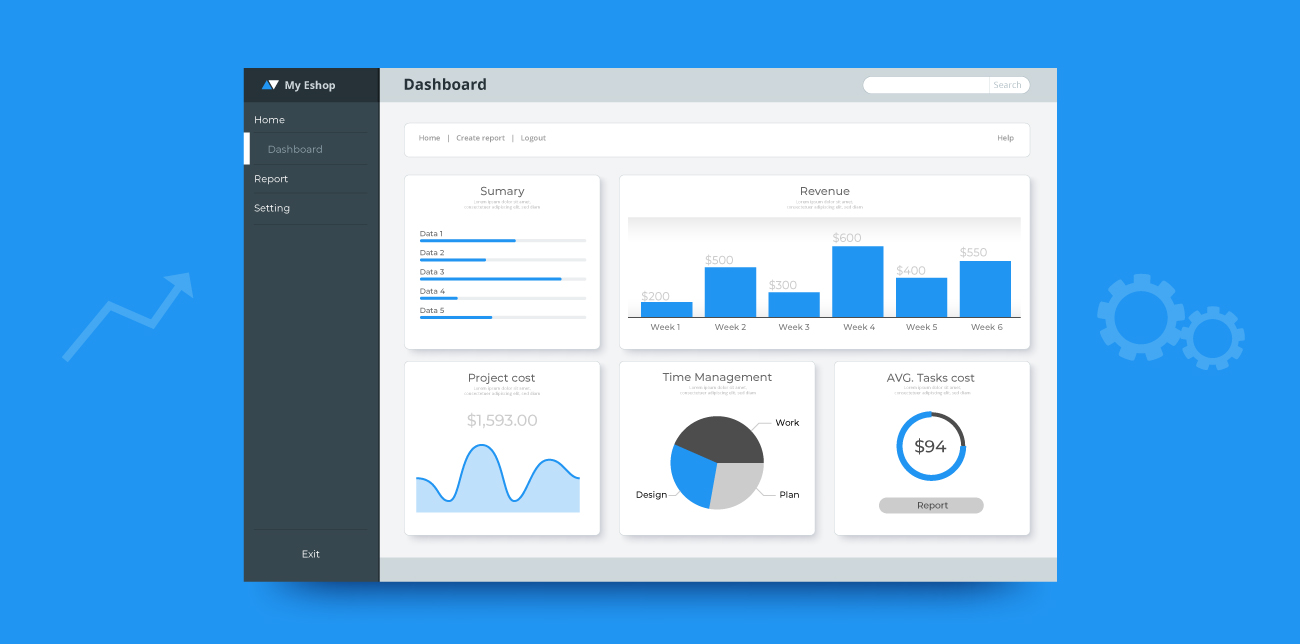
An eCommerce dashboard is essential for retail brands looking to optimize their operations and make data-driven decisions. By providing an in-depth view of decisive metrics and KPIs, the dashboard helps businesses stay ahead of the curve and make informed decisions about their eCommerce strategy. A well-designed eCommerce dashboard should be both intuitive and comprehensive. Read on to see the must-have KPIs and metrics you must include in your dashboard and the guiding principles for optimal dashboard layout. Table of Contents > One-minute FAQ to fully understand an eCommerce dashboard > Creating an insightful eCommerce dashboard for retail > eCommerce dashboard
The 50 most important Mother’s Day statistics for retailers
When most business leaders picture major holidays, they focus on Christmas, Easter, and Valentine’s Day. These are all important events, of course, but there’s no denying the impact of Mother’s Day on the retail sector. Whether purchased from adoring children or with a sense of obligation, Mother’s Day gifts and cards represent a clear priority for most consumers in the UK and US. Retailers that capitalize on this opportunity can see immense boosts in both online and in-person sales during the spring, not to mention enhanced engagement long after Mother’s Day has come and gone. In this article, we reveal
Black Friday statistics: The 80 most important stats for retailers (2023 Update)
In retail, Black Friday remains one of the most critical days in the fiscal year for connecting with customers and generating sales. Even with COVID-19 related shutdowns impacting the economy and shopping patterns, Black Friday sales grew by 22% in 2020, totaling about $9 billion in the United States. In 2021 things were a little bit different, meaning that the internet spending by American consumers only was $8.9 billion, which was less than the average spend of 2020. Although Thanksgiving in November is unique to the United States, the Black Friday shopping frenzy has caught on worldwide, especially with the rise
Retail Customer Engagement Statistics: 55 Stats You Need to Know
What’s at the heart of any business? Products, services, profits? All of these things are important, but at its core, a business is about people. The way you engage with your customers will shape the future of your company, in more ways than one. It only takes a matter of minutes for an unhappy customer to post about their experiences online, devastating the value of your brand on a public platform. On the other hand, customers can boost your brand image with positive reviews and continued loyalty. Engaging with your customers will tell you a lot about them too—their pain
Marketing Automation Statistics for eCommerce [2023]
Increasingly, customers expect marketing communications that go beyond a generic email blast. Personalization is in. This means eCommerce marketers need to focus on creating more relevant and valuable customer engagements. A core component for success in the eCommerce industry is Μarketing Automation. Marketing Automation helps engage customers in a more personal and valuable fashion. It allows marketers to target shoppers with the correct message at the optimal time. Marketing messages can be triggered based on previous consumer behavior, preferences, and purchase history. In this post, we’ve gathered the latest marketing automation statistics you need to know for 2023. Here are
Valentine’s Day Statistics: Get Informed On This Romantic Day [Infographic]
Here at the pigeon coop, we understand that Ecommerce managers are always on the lookout for the inside scoop on the latest Valentine’s Day statistics. Look no further! Our pigeons are tweeting songs of love this time of year as Valentine’s Day is fast approaching. In this post, we are spreading the love by sharing our infographic and going over all that you need to know about Valentine’s day statistics for this romantic holiday! You might not have realized, but, Valentine’s Day is only seconds behind to Black Friday in commercial status. With the increase in popularity of this holiday
The 88 most amazing Ecommerce Statistics of 2023
Every marketer needs to be in the know-how of the latest eCommerce statistics in order to ride the wave of ever-changing trends. By knowing what your consumers are looking for, you will have all the information and tools you need to set up your brand for success with a solid eCommerce marketing strategy. In 2018, eCommerce progressed on a global scale, and the proof, is in the pudding. In 2018, we witnessed technology and marketing automation soar to new heights and achieve record-breaking Black Friday weekend sales totaling $18 billion in turnovers — just in the United States alone! ECommerce
Grow Conversions with New Pop-up Triggers and Email Statistics for Lists
Happy New Year! At the pigeon coop, we like to kick off 2019 with a bang, and this means rolling out shiny new features on our platform. This month we introduce two exciting features that are designed to increase your website and campaign conversion rates: Advanced Pop-up Triggers and Campaign Statistics for Lists. In this post, we will explain the changes that are already live in your ContactPigeon account and discuss situations where they come in handy for growth. Let’s get started! Table of Content Introducing an easy way to add more advanced Pop-up triggers 1. Based on the time
Valentine’s Day Infographic: Email Marketing & eCommerce Insights
Valentine’s Day has become more than just a western holiday celebrating love and romance, but an international holiday with substantial commercial success. As a holiday, it has achieved the commercial status that’s only surpassed by Black Friday and Christmas. According to National Retail Federation estimate, the average American would spend $136.57 this year celebrating Valentine’s Day, with an overall estimate at $18.2B in retail spend for 2018. Here at ContactPigeon, we are also curious to find out how the last Valentine’s Day fared for our eCommerce customers1. Here are the key findings from 2018 Valentine’s Day infographic on the email marketing and eCommerce data.
56 Christmas Marketing Statistics to Know for This Holiday Season
Most companies start planning their Christmas marketing strategy long before the actual holiday. That’s why it may seem like the Christmas season starts earlier and earlier every year! However, holiday marketing campaigns really go into full effect during the months of November and December. During this time, businesses around the world start filling inboxes with notes, coupons, special sales and more. If you’re smart about it, Christmas is one of the very best times of year to engage with your customers and boost sales. The key is to create campaigns that can get heard above the noise of all the